ASO course · lesson 1 of 60
ASO fundamentals: diagnose your app growth bottleneck
Choose whether discovery, listing conversion or the product experience is the first constraint to investigate.
By Gabriel Machuret · Editorial methodology
Before you start: A live app or a realistic product concept and one target market.
Module 1: Foundations and diagnosis
Foundations · 25 minutes reading + 35 minutes practice
Your outcome: a written diagnosis that identifies the next growth question to investigate, the evidence needed, and the person responsible. You will calculate acquisition and activation rates, challenge competing explanations, and hand over a brief another person can act on.
Define what useful growth means
A team asks you to improve its app store performance. The obvious work is to rewrite the title, research keywords, or redesign screenshots. Before you choose any of those tasks, establish what the business needs more people to do. Otherwise, you can produce a better-looking listing while leaving the actual growth problem untouched.
App store optimization helps relevant people discover an app and understand why it is useful. Its commercial value depends on what happens next. A download is an acquisition event. It does not establish that the person understood the offer, completed onboarding, or received value. A strong ASO practitioner follows the promise from search and store presentation into the product experience.
For this lesson, use Trail Notes, a fictional hiking journal. It lets walkers save memories and photos from a walk. It does not provide turn-by-turn navigation. All numbers and research observations in this case are constructed teaching data. The exercise is to reason from a defined dataset, not to copy a market benchmark.
Compare two briefs. “Increase downloads” gives you a quantity to chase but no definition of a useful customer. “Increase the number of new Australian iOS users who save a first walking journal within seven days” specifies an audience, a meaningful action, and a time window. The second brief connects acquisition to something the product exists to deliver.
Do not assume that the first convenient event is activation. Opening an app or accepting a permission is often only a step toward value. For Trail Notes, saving a journal is a reasonable working definition because it creates the object the user came for. Later, the team should investigate whether that event predicts continued use. In a booking app, a useful first action might be completing a booking; in a language app, completing a meaningful practice session.
Write now: “We want more [specific users] to complete [valuable action] within [window], while monitoring [downstream outcome].” For Trail Notes, the downstream check is whether those users return to create another journal. A first action that never leads to continued value is a reason to examine the definition and the experience.
Map the journey and its possible failure points
Draw five stages: discovery, store decision, first use, activation, and return. Under each, write a question. Can the intended audience find us? Does the listing communicate the right promise? Can the app open and work? Does the user reach first value? Is there a reason to return?
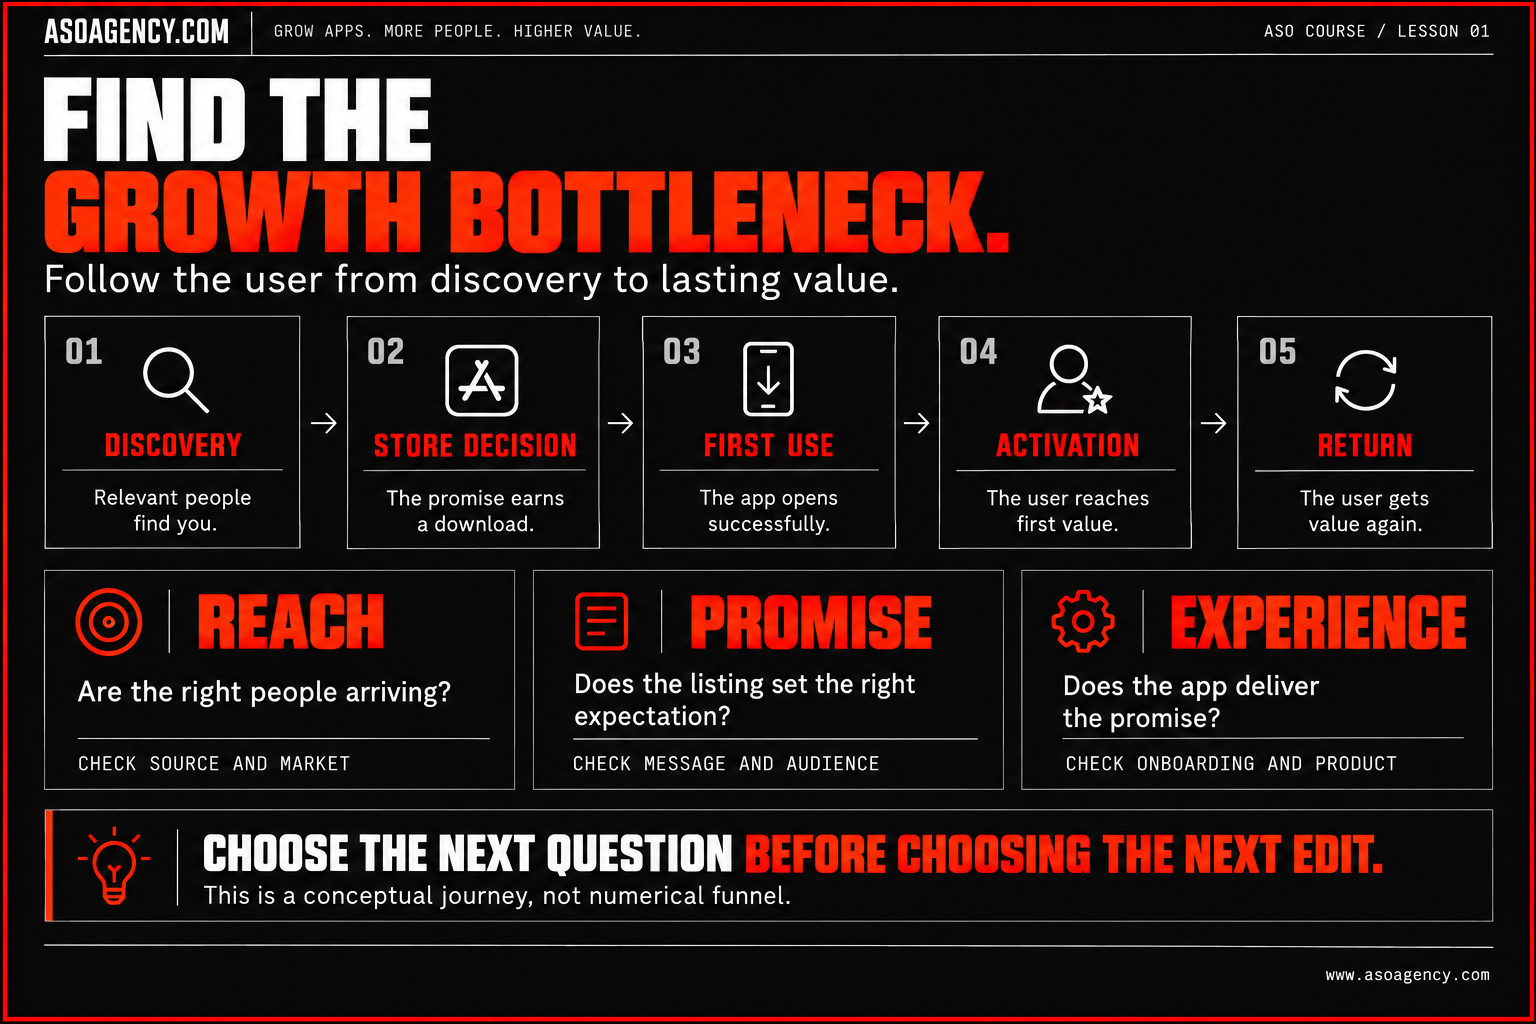
This is a conceptual journey. It is not an instruction to divide any five numbers you can find in different reports. Some people download directly from search results, and a product-page visit may not precede every download. Store reports and product analytics may count different populations. You will resolve those measurement boundaries before calculating a rate.
A discovery problem might involve limited exposure to relevant non-brand searches. A store-decision problem might involve an unclear promise or assets that fail to answer an important objection. A first-use problem might involve a crash or blocked login. An activation problem might involve difficult onboarding, an unsuitable audience, or an event that stopped recording. Similar-looking numbers can come from very different causes.
The biggest percentage drop is not automatically the best opportunity. Moving between distant stages can have naturally different rates, costs, and time windows. A small improvement at a commercially valuable stage may matter more than a large improvement in a low-value audience. You need evidence about the mechanism and the likely effort, not just the most dramatic-looking funnel.
Build a measurement record before diagnosing
For each number, save its exact metric name, source report, dates, filters, counting unit, and inclusion rules. If you write “conversion is 20%,” your colleague should be able to reconstruct the numerator and denominator. Does that mean downloads divided by impressions, install clicks divided by listing visitors, or users who completed onboarding divided by first opens?
| Field | Trail Notes example | Why it matters |
|---|---|---|
| Outcome | Saved first journal within seven days | Defines the action being optimized. |
| Population | New eligible users, iOS, Australia | Prevents mixing returning users or different markets. |
| Cohort | Users acquired during each comparison window | Connects the later action to its acquisition group. |
| Observation window | Full seven days after acquisition for every member | Prevents recent users looking worse because they had less time. |
| Source and definition | Product event: first_journal_saved; one user counted once | Makes the calculation reproducible. |
| Coverage | Record missing events and unavailable attribution | Shows whether the observed population is incomplete. |
| Context | App release, campaigns, pricing and listing changes | Identifies plausible alternative explanations. |
Read the store’s definition, not just the label
Apple’s documented conversion rate uses total downloads and unique impressions. It is not simply a product-page-visitor conversion rate. Apple’s App Store search source also includes search-ad activity. A rise in that source alone does not establish organic search growth. See Apple’s acquisition definitions.
Google’s current store listing reporting guidance describes a 2026 move toward unique install, open, and pre-register clicks. A click expresses intent; a completed acquisition is a different outcome, available in other reports. Preserve the exact metric and date when comparing exports across the reporting change. See Google’s store listing performance guidance.
Keep native store measures separate from your own product activation measure. If you cannot reliably connect them at cohort level, report the two views separately and explain the boundary. Do not invent a joined funnel by dividing unrelated totals. Check event instrumentation with a known test journey before interpreting a sudden collapse in activation.
If you do not have console access
Start with a public evidence review. Capture the listing, its language and market, the visible product promise, and the actual app experience if accessible. Record a dated observation such as “the opening screenshot says navigate, but the released app provides a journal.” Request private data for performance questions. A public rating, a ranking snapshot, or a competitor’s attractive design cannot tell you your app’s private conversion rate.
Work the numbers: downloads rise, useful growth stalls
For the following exercise, assume a fully observed, deduplicated teaching dataset. Its eligible visitors, attributed new downloads and later activations have been reconciled for the same two cohorts. Both cohorts have completed their seven-day observation window. These are custom exercise measures, not names for either store’s native conversion report.
| Measure | Before | After |
|---|---|---|
| Eligible listing visitors | 10,000 | 12,000 |
| Attributed new downloads | 2,000 | 3,000 |
| Users saving a journal within seven days | 600 | 600 |
| Download / visitor | 20% | 25% |
| Activated / download | 30% | 20% |
| Activated / visitor | 6% | 5% |
Calculate the first rate: 2,000 ÷ 10,000 = 20%. After the change, 3,000 ÷ 12,000 = 25%. That is an increase of five percentage points, or 25% relative to the original 20% rate. Downloads increased by 1,000, a 50% relative increase. Neither calculation tells you whether users received value.
Now calculate activation among downloads: 600 ÷ 2,000 = 30%, compared with 600 ÷ 3,000 = 20%. That is a decrease of ten percentage points. The absolute number of activated users remains 600. Finally, the share of visitors reaching activation falls from 600 ÷ 10,000 = 6% to 600 ÷ 12,000 = 5%.
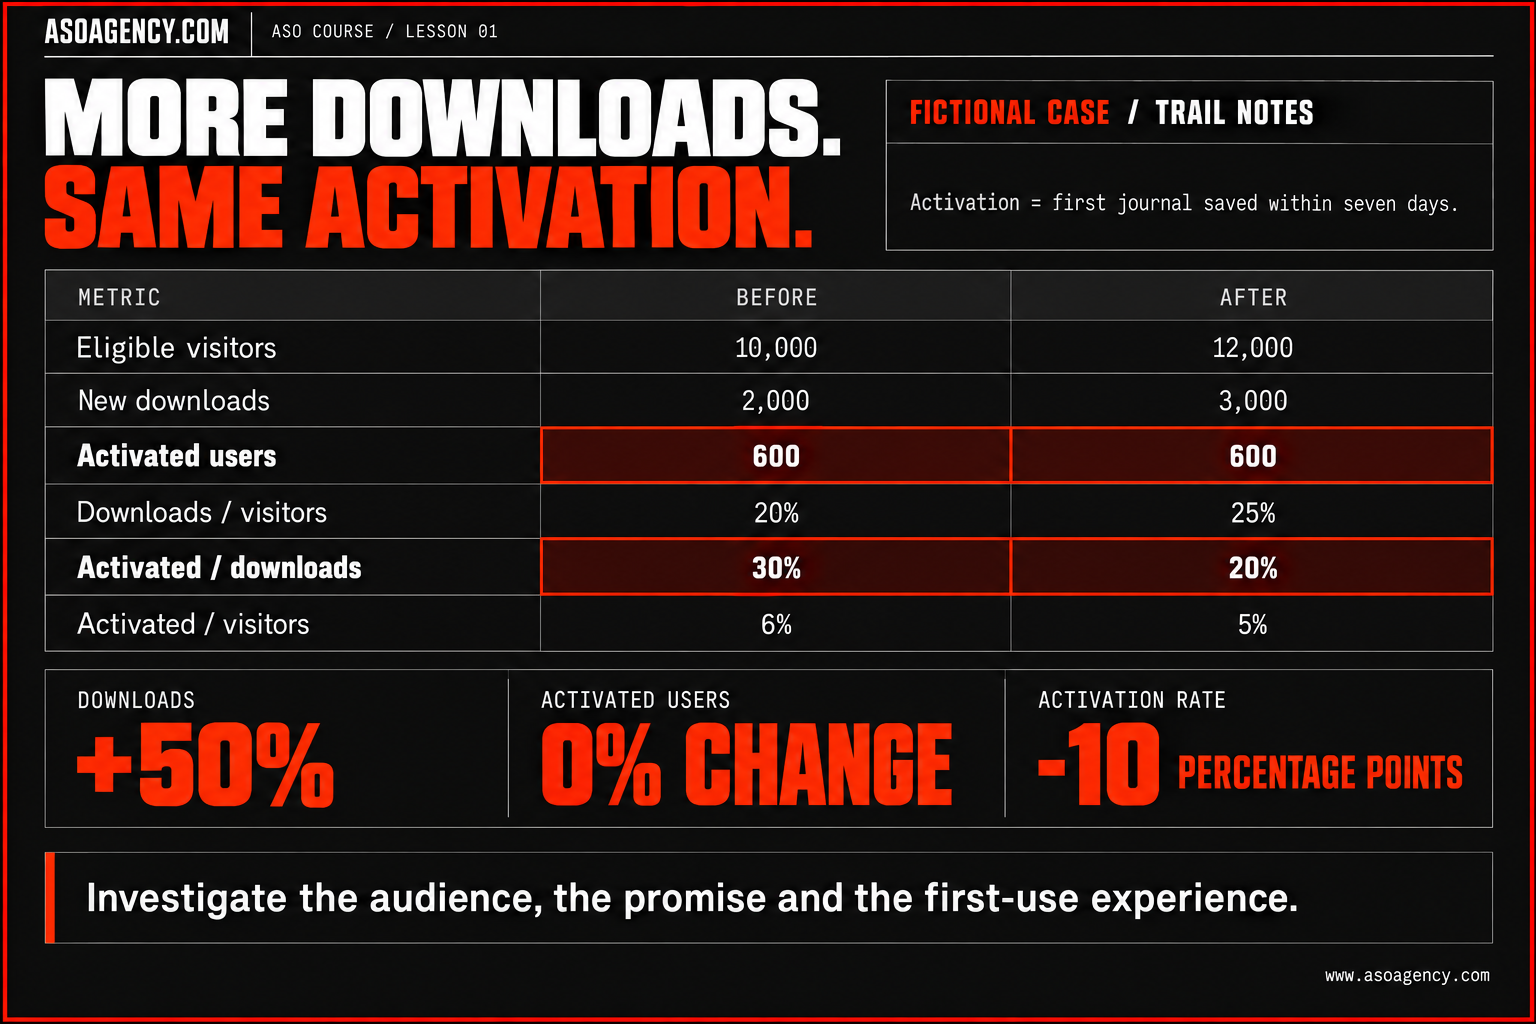
The defensible conclusion is that acquisition volume increased while the defined activation outcome did not. You cannot yet say that screenshots caused poorer activation. You also cannot claim success against the stated objective simply because downloads rose. The numbers locate a question; the investigation must explain the mechanism.
Use scenarios to understand scale
At 3,000 downloads, a return to a 30% activation rate would imply 900 activated users: 300 more than the current 600. At the current 20% activation rate, reaching 900 would require 4,500 downloads. These are arithmetic scenarios with the other factors held fixed. They help compare the scale of possible opportunities; they do not establish that restoring 30% is achievable or cheaper than acquiring more users.
The exercise formula is: activated users = eligible visitors × download rate × activation rate. Before: 10,000 × 0.20 × 0.30 = 600. After: 12,000 × 0.25 × 0.20 = 600. Use this decomposition only when the stages describe compatible populations. It helps expose why a gain in one stage may be offset elsewhere.
Compare explanations before choosing a fix
Suppose the teaching case also includes a new “find your next trail” acquisition message and several support conversations asking where navigation is. That makes an expectation mismatch plausible. It still leaves other explanations open. The same release may have introduced a save error, or tracking may have stopped recording successful journals.
| Explanation | Evidence to seek | What would weaken it? |
|---|---|---|
| New users expect navigation | Compare message exposure and source mix; ask new users what they expected. | Users accurately describe journaling but fail on the same product step. |
| Onboarding or saving is broken | Reproduce the first-journal journey; inspect errors by app version and device. | The journey works and activation differs mainly by acquisition message. |
| Activation measurement changed | Trace a known saved journal through the event pipeline and release log. | Recorded events reconcile with completed journals and definitions are stable. |
Start with inexpensive checks that could invalidate the diagnosis: validate the event, review releases, and reproduce first use. Then compare like-for-like source, market and version groups where sample size permits. An overall decline can be caused by a change in audience mix even if each existing group performs similarly. Small segments should produce cautious questions, not confident verdicts.
A handful of interviews can reveal confusing language and possible mechanisms. They cannot estimate the percentage of all users affected. Record the recruitment method and ask open questions such as “What did you expect to do after downloading?” before introducing navigation as an answer. Compare the responses with behavior and message exposure.
If the listing demonstrably claims a feature the app lacks, correct the inaccurate claim. You do not need an experiment to justify accuracy. Keep a dated change record and continue investigating the performance problem. A later improvement could still reflect concurrent changes; the correction and the causal claim are separate decisions.
Write a handover someone can execute
Your handover should let a product owner or analyst continue without asking what you meant by “fix conversion.” Include the following six parts, with the actual evidence attached or linked. The brief can be short because its supporting record is precise.
A. Scope and outcome
Name the app, platform, storefront, language, app versions, cohort dates and observation window. Then write the user outcome. In our case: increase new Australian iOS users saving a first journal within seven days. This prevents a later reviewer treating a different market or repeat-download population as the same project.
B. Baseline and calculation
Keep the original counts beside the rates: 3,000 downloads, 600 activated users, 20% activation per download. Link the source export and metric definitions. Do not hand over only “activation is down 10%”: the exercise shows a ten-percentage-point decrease, which is a different statement. Include the comparison cohort and its maturity.
C. Evidence and interpretation
Separate what happened from why you think it happened. Observation: activated users stayed at 600 while downloads rose. Hypothesis: new messaging attracted people seeking navigation. Attach the relevant assets and research notes. The distinction lets a reviewer challenge the explanation without losing the underlying observation.
D. Alternatives and unresolved gaps
List tracking failure and onboarding friction alongside audience mismatch. For each gap, state its decision impact. For example: “We have not reconciled first_journal_saved with saved journals; until that check passes, the apparent activation decline may be a reporting problem.” A useful gap names the consequence of not knowing.
E. Next action, owner and evidence
Assign a concrete role and output. The product analyst reconciles known saves with events; the mobile engineer checks first-use errors by version; the ASO lead reviews listing promises and acquisition messages. Each action needs an agreed due date. “Team to investigate” leaves accountability unresolved and cannot be scheduled.
F. Decision rule and review
State what each result changes. If instrumentation is broken, repair measurement and rebuild the baseline. If the released product fails during saving, prioritize the product defect. If the journey works but users repeatedly describe an unsupported promise, correct inaccurate copy and develop a clearer message for testing. Set a review date and list the evidence that must be available at that review.
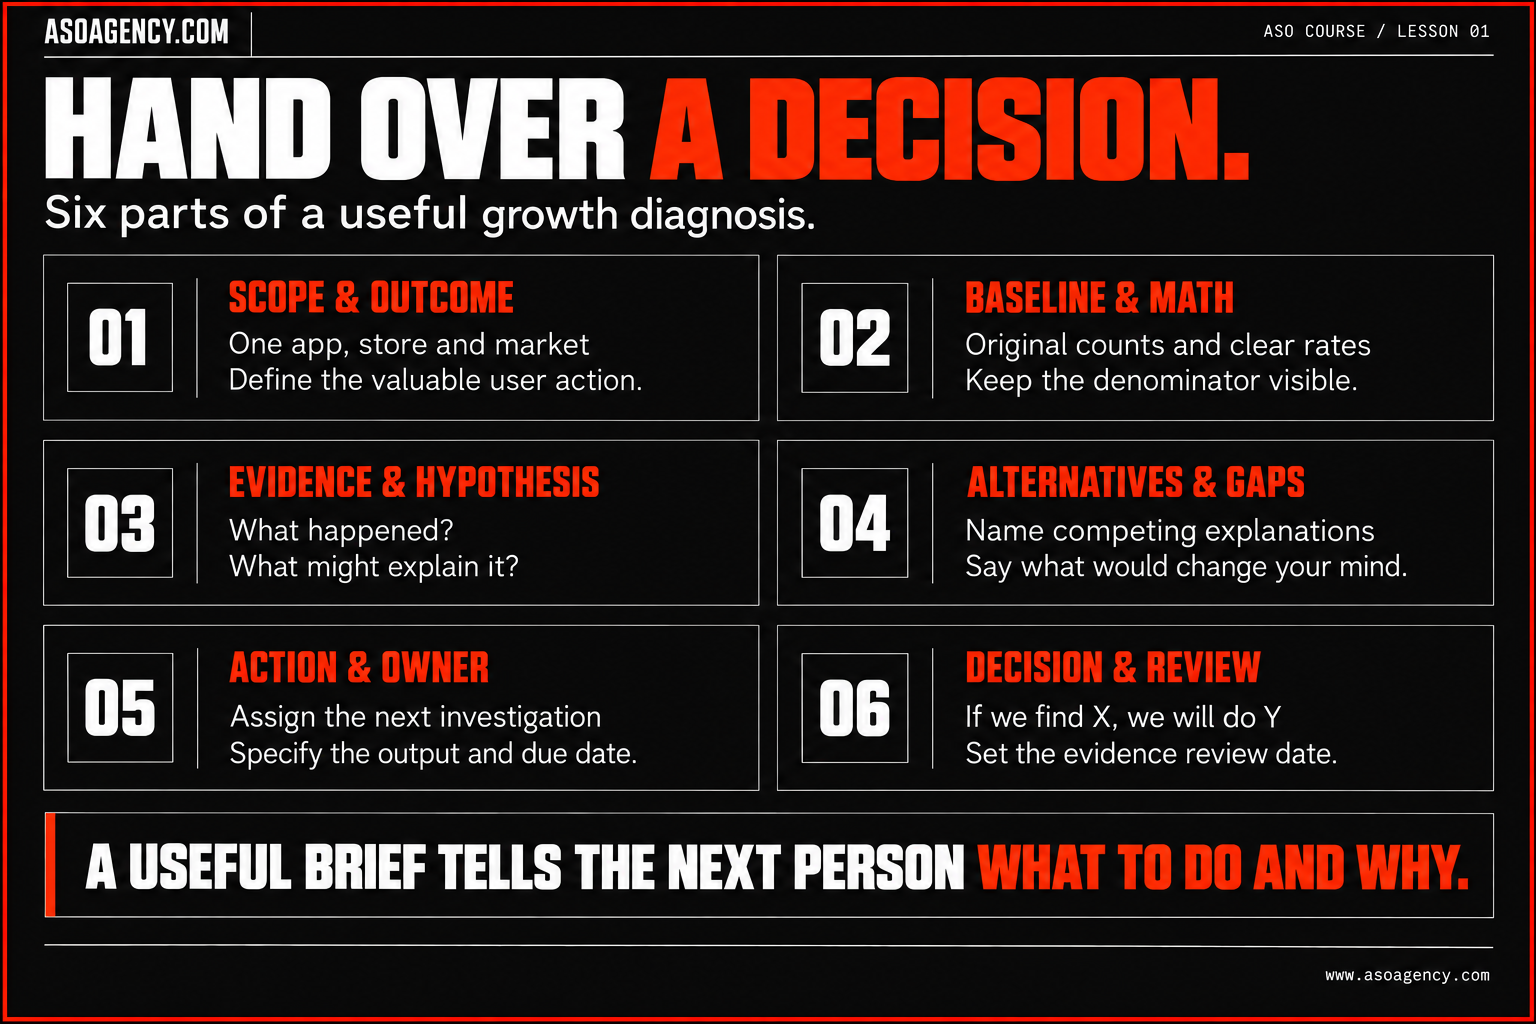
Worked handover summary
Trail Notes needs more new Australian iOS users to save a journal within seven days. In the teaching cohorts, downloads rose from 2,000 to 3,000, while activated users remained at 600. Activation per download fell from 30% to 20%. Expectation mismatch is the initial hypothesis because the acquisition message suggests trail finding. Tracking and onboarding remain competing explanations.
Before the next review, the analyst will reconcile activation events, the engineer will reproduce journal creation, and the ASO lead will document the current promise. If measurement and saving work, the team will investigate expectations by source and message. Any verified unsupported navigation claim will be corrected immediately and recorded in the change log.
Your ASO assignment
Use your app or complete the Trail Notes case. Budget approximately 35 minutes. With a real app, gathering missing evidence may take longer; the deliverable can identify those requests without pretending they have been answered.
- Define the outcome — 5 minutes. Choose one store and market. Specify a useful first action and its time window. Explain why that action represents value.
- Map the evidence — 10 minutes. Draw the five-stage journey. Add a source and metric definition to each measurable stage. Name an owner for any missing information.
- Calculate and challenge — 10 minutes. Reproduce the six measures in the case table or calculate compatible rates from your own data. Write one observation and at least two competing explanations. State what would weaken your preferred explanation.
- Hand over — 10 minutes. Complete the six-part brief. Give the next action an owner, an output and a review date. Explain how different findings change the decision.
Download the diagnosis workbook
Assessment: what a strong submission contains
- Scope: one identifiable population and a meaningful outcome, with dates and observation windows.
- Measurement: counts and rates that can be reconstructed; metric names and denominators are explicit.
- Reasoning: observations are separated from hypotheses, with at least one plausible alternative.
- Decision: the investigation can change the next action, rather than merely justify a preselected rewrite.
- Execution: a named role, required output and review date make the handover usable.
If any of these is missing, revise that part before marking the lesson complete. A well-written brief with invented evidence is incomplete; a transparent brief with a specific evidence request can be useful immediately.
Knowledge check: downloads increased by 50%. Did useful growth improve?
Not on the lesson’s defined activation measure. Activated users stayed at 600, while activation per download fell from 30% to 20%. This does not prove the acquisition change caused the decline. Investigate measurement, product behavior and audience mix before choosing a performance intervention.
Knowledge check: should you fix the stage with the largest drop?
Not automatically. Check comparable populations, business value, effort and the mechanism first. A large normal transition loss may be less actionable than a smaller defect. The next step should resolve an important decision with credible evidence.
Knowledge check: what changes if you only have a public listing?
You can review observable claims and clarity, compare them with the released experience, and document market context. You cannot diagnose private conversion or retention. Your output becomes a scoped public review and a precise request for the missing performance evidence.
Sources and further reading
Platform definitions checked 29 September 2026. The diagnostic framework, Trail Notes dataset and worked calculations are original course teaching material.
- Apple: acquisition sources and conversion definitions — supports the distinction between impressions, page views, downloads and search sources.
- Apple: metric definitions — use when recording the exact meaning of an exported measure.
- Google Play: understand and grow your user base — explains current listing-click reporting and where completed acquisition data is available.
Your ASO lesson notes
Use this space for your assignment, evidence and handover. Select Save to keep a draft in this browser, or download a copy to take with you.
Notes stay on this device and are not submitted to ASO Agency.
Complete your assignment with the Interactive ASO audit checklist.
Loading your progress…
Progress is saved only in this browser. It does not sync across devices. Mark a lesson complete after doing its exercise.