ASO course · lesson 51 of 60
ASO measurement: activation, retention and user value
Evaluate whether acquired users reach product value using matched cohorts and explicit assumptions.
By Gabriel Machuret · Editorial methodology
Before you start: A defined first useful action and appropriately aggregated product analytics.
Module 9: Measurement and growth integration
Plan about 55 minutes for reading, practice and review
You will produce: A cohort-quality report and an assumption-labeled opportunity model.
Understand the decision
Choose an activation event that represents value
An app open is convenient to count but may not mean the user received the intended benefit. For a journal, saving a meaningful first entry may be more informative. Define the event, eligible users and time window with the product team. Validate that the event is recorded reliably before using it to judge an acquisition audience or listing promise.
Keep cohort windows comparable
Users acquired yesterday have not had the same chance to return as users acquired a month ago. Compare cohorts with equal observation windows and consistent inclusion rules. Distinguish first-time users, reinstalls and other states where the data permits. If store and product data cannot be linked reliably, do not present a stitched aggregate funnel as a precise user-level journey.
Model value without turning assumptions into forecasts
A conversion scenario can translate a possible rate change into additional outcomes under fixed traffic. Any value per install is an assumption requiring product evidence and a clear definition. Retention, paid conversion, refunds and costs may alter the commercial result. Present ranges and limitations rather than promising revenue from a simple visitor-to-download calculator.
Apply the method in practice
Define useful behavior for the product
Choose an activation event that represents first value, then a return or retention measure appropriate to the use case. A hiking journal may not be used daily, so daily activity is not automatically the best success criterion. Explain the event, eligible population and time window. Validate that the event is recorded correctly and that it reflects a meaningful action rather than an incidental screen view. Treat the definition as a testable product assumption that can be refined as evidence accumulates.
Compare cohorts with equal opportunity
Group users by a meaningful acquisition period or source where measurement permits and allow the same follow-up window. A cohort acquired yesterday cannot fairly be compared on seven-day retention with one acquired last month. Record missing attribution and coverage limitations. Do not join anonymous store totals to identified product users as if they were an exact person-level funnel. If the systems cannot be reconciled, report complementary views and make the boundary visible rather than inventing precision.
Evaluate quantity and quality together
A higher activation rate can coexist with fewer activated users if acquisition volume shrinks. A lower rate can coexist with more useful users if relevant volume grows. Show both counts and rates, then consider retention and economic value where reliable data exists. Revenue comparisons need a consistent observation window and clear treatment of trials, refunds or other business-specific factors. The lesson's objective is to connect acquisition decisions to useful outcomes, not to create a universal lifetime-value formula from incomplete data.
Platform references for this work: Apple — Acquisition analytics · Google Play — Understand and grow your user base
Your step-by-step procedure
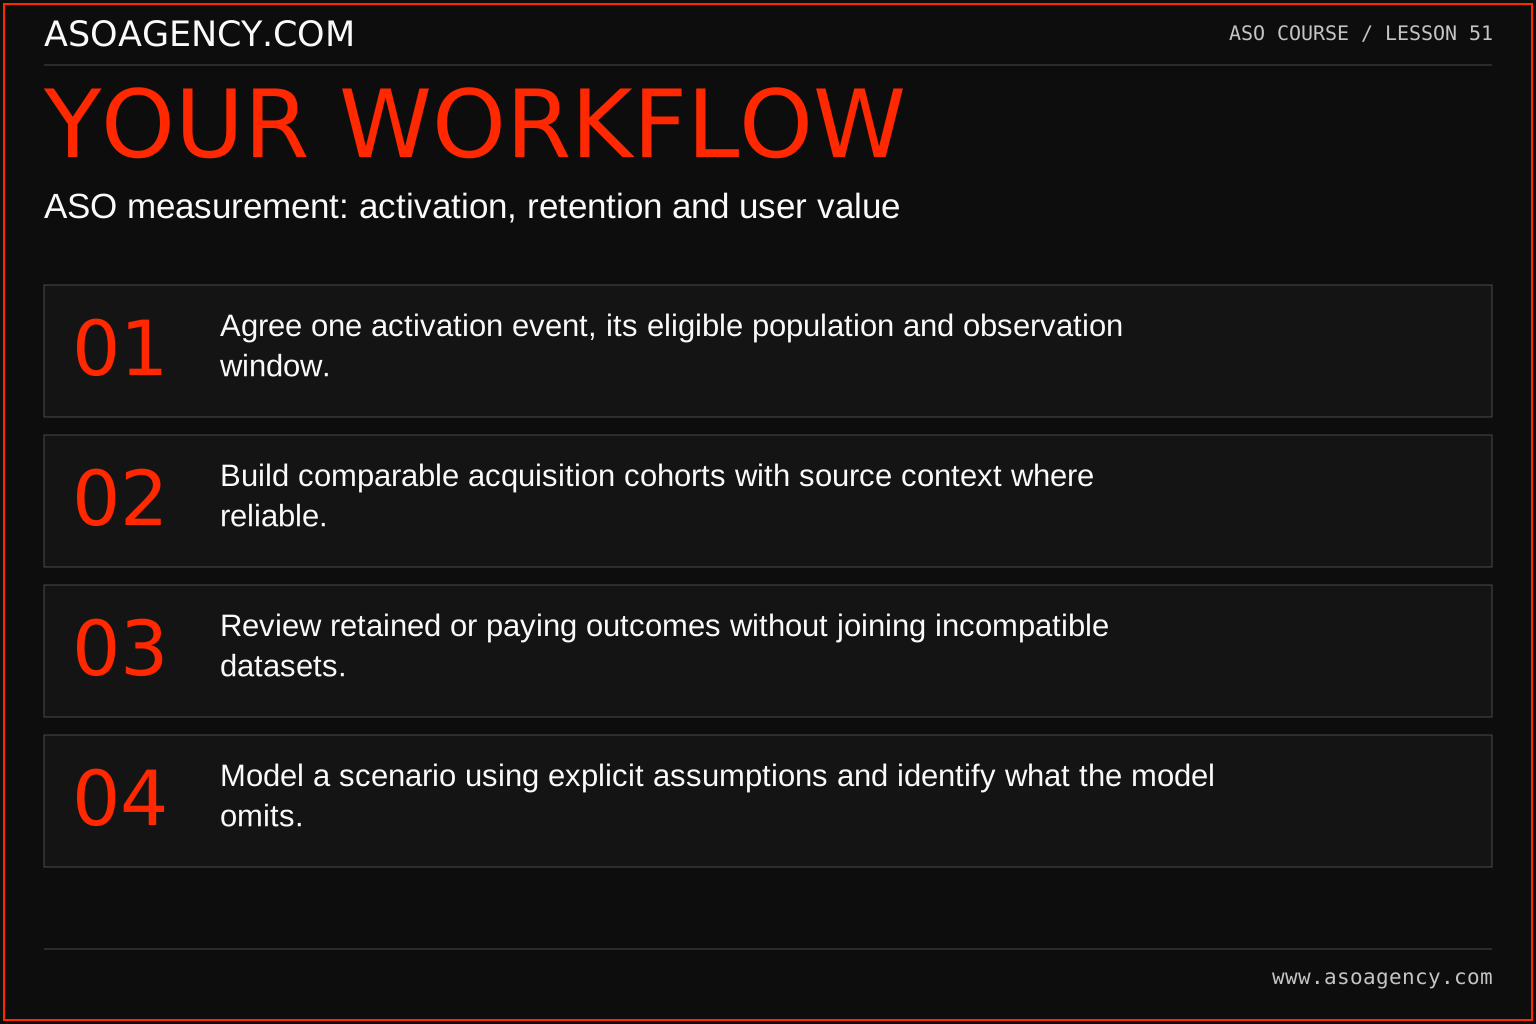
- Agree one activation event, its eligible population and observation window.
- Build comparable acquisition cohorts with source context where reliable.
- Review retained or paying outcomes without joining incompatible datasets.
- Model a scenario using explicit assumptions and identify what the model omits.
Worked example and interpretation
Trail Notes and numerical research scenarios are fictional teaching examples. Platform limits, where shown, come from the linked official references.
Two fictional cohorts illustrate quantity and quality. Cohort A has 1,000 new users and 300 activations; cohort B has 2,000 new users and 500 activations. B has more activated users but a lower activation rate. The team examines comparable retention and economic outcomes before deciding whether to expand that acquisition.
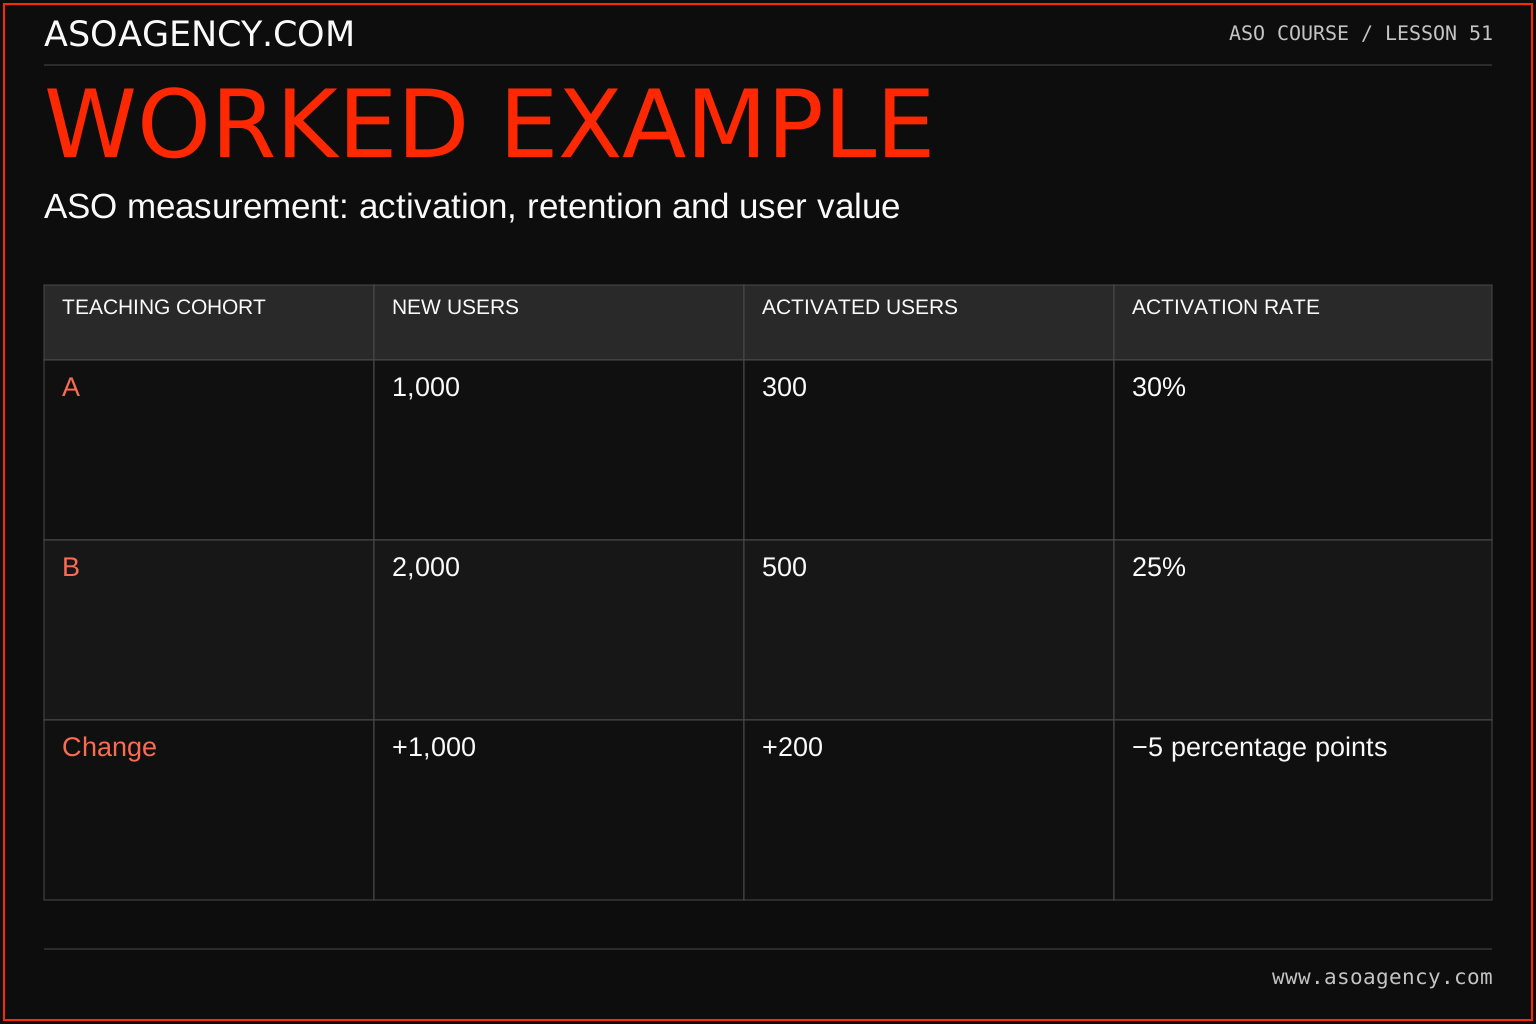
| Teaching cohort | New users | Activated users | Activation rate |
|---|---|---|---|
| A | 1,000 | 300 | 30% |
| B | 2,000 | 500 | 25% |
| Change | +1,000 | +200 | −5 percentage points |
Cohort B has a lower activation share but more activated users. Neither metric alone captures the whole result. If acquisition cost, retention or support burden changed, those may alter the commercial decision. Report the quantity and quality tradeoff and investigate whether the new users receive sustained value. The table is a constructed example, not a benchmark for journal apps.
Build a handover someone can use
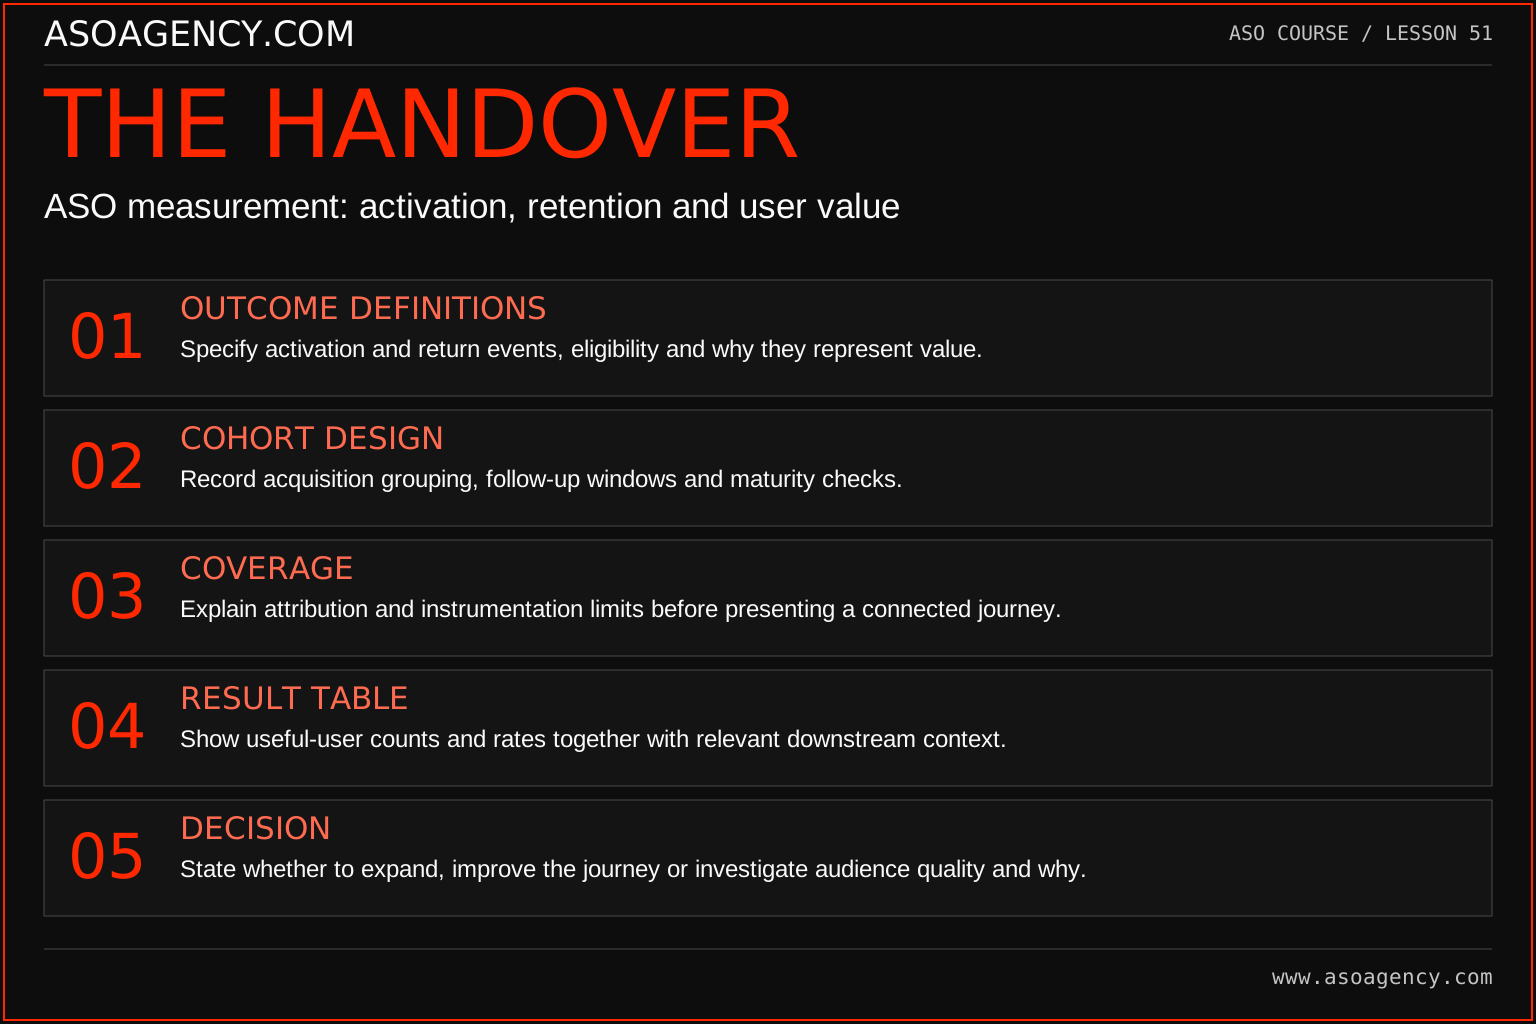
Outcome definitions
Specify activation and return events, eligibility and why they represent value.
Cohort design
Record acquisition grouping, follow-up windows and maturity checks.
Coverage
Explain attribution and instrumentation limits before presenting a connected journey.
Result table
Show useful-user counts and rates together with relevant downstream context.
Decision
State whether to expand, improve the journey or investigate audience quality and why.
Your ASO assignment
Use your own app and evidence, or work through the teaching case. Keep your observations separate from assumptions and explain the reasoning behind your decisions.
- Define an activation event with the product owner or as a labeled practice assumption.
- Create a cohort comparison with equal windows.
- Write a value scenario and list three reasons it may differ from realized results.
Scenario challenge
A team rejects cohort B because its activation rate is lower. Explain what the table establishes, what remains unknown and which additional outcomes would inform a commercial decision.
Assess your work
- Activation represents a meaningful product action.
- Cohort observation windows and definitions match.
- Scenario value is not presented as guaranteed revenue.
Common mistakes to catch
- Comparing mature retention with a cohort that has not completed the observation window.
- Treating lower cost per download as proof of better user value.
Knowledge check
A new listing brings more downloads but fewer seven-day activated users. What should be investigated?
Read the answer and reasoning
Check audience mix, expectation alignment, onboarding changes and event reliability. Compare matched cohorts before blaming the listing. The absolute activated-user outcome matters, but its cause requires evidence. Revisit the acquisition promise if it attracts people whose needs the product does not serve.
Sources and further reading
Platform references reviewed 29 September 2026. These sources support platform capabilities and constraints; the teaching frameworks, assignments and illustrative cases are original course material.
- Apple — Acquisition analytics — Acquisition metric definitions and source attribution.
- Google Play — Understand and grow your user base — Current listing-click reporting, completed acquisitions and segmentation.
Your ASO lesson notes
Use this space for your assignment, evidence and handover. Select Save to keep a draft in this browser, or download a copy to take with you.
Notes stay on this device and are not submitted to ASO Agency.
Complete your assignment with the App store conversion calculator.
Loading your progress…
Progress is saved only in this browser. It does not sync across devices. Mark a lesson complete after doing its exercise.