ASO course · lesson 5 of 60
ASO metrics: build your measurement baseline
Create comparable definitions for visibility, acquisition and activation before analyzing change.
By Gabriel Machuret · Editorial methodology
Before you start: The evidence register and access to available aggregate reports.
Module 1: Foundations and diagnosis
Plan about 50 minutes for reading, practice and review
You will produce: A metric dictionary and baseline table with counts, filters and known limitations.
Understand the decision
A rate is a definition
A conversion rate has a numerator, denominator, eligible population and time period. Downloads divided by product-page views is not automatically equivalent to a console’s official conversion metric. Store reports may count different units or include different paths. Preserve the source metric name and its documentation; if you calculate your own ratio, give it a descriptive name rather than borrowing a familiar label.
Create a baseline you can reproduce
Use a period that represents the decision context and note holidays, launches and unusual campaigns. A longer period can hide a recent product change; a short period can amplify random variation. Record the rationale for the chosen baseline and keep comparable segments beside the total. Baselines are reference points, not promises that traffic will stay constant.
Connect upstream and downstream outcomes
Visibility matters only in relation to relevant acquisition and product value. Pair the primary listing metric with a guardrail such as activation or retained users when measurement permits. Do not join datasets that describe different users as if they were a single funnel. State attribution gaps and reporting delays so your analysis does not imply precision the instrumentation cannot provide.
Apply the method in practice
Write the counting rule in human language
For every metric, specify what qualifies, the unit counted and when the event belongs to the report. “Visitors” may refer to users or devices within a period; “downloads” may include redownloads depending on the field. Do not replace the platform definition with an assumption because the label looks familiar. Record the documentation link and review date. For a custom metric, write the formula and the eligibility rule together. A ratio with mismatched populations can be mathematically correct and analytically useless, especially when combining store and product analytics.
Aggregate counts before rates
When two compatible segments have different sizes, averaging their percentages gives the small segment too much influence. Sum numerators and denominators first, then calculate the combined ratio. Keep segment rows because the total can still hide a change in mix. The same caution applies to time: unique visitors reported daily may not add to unique visitors across a month. Use the source report at the required aggregation level and preserve its uniqueness rule rather than adding daily unique totals and calling them monthly unique people.
Choose a baseline that answers the decision
Use comparable observation windows, not simply the most flattering period. Include enough context to recognize promotions, app releases and seasonal demand. When measuring a seven-day activation outcome, allow every cohort member seven days before comparing it with a mature cohort. Record reporting delays and instrumentation changes. If a definition changes, mark a series break instead of drawing an uninterrupted improvement line. A baseline should be a reproducible reference; it can be revised when a documented measurement problem is discovered, with the earlier version retained.
Platform references for this work: Google Play — Understand and grow your user base · Apple — Acquisition analytics
Your step-by-step procedure
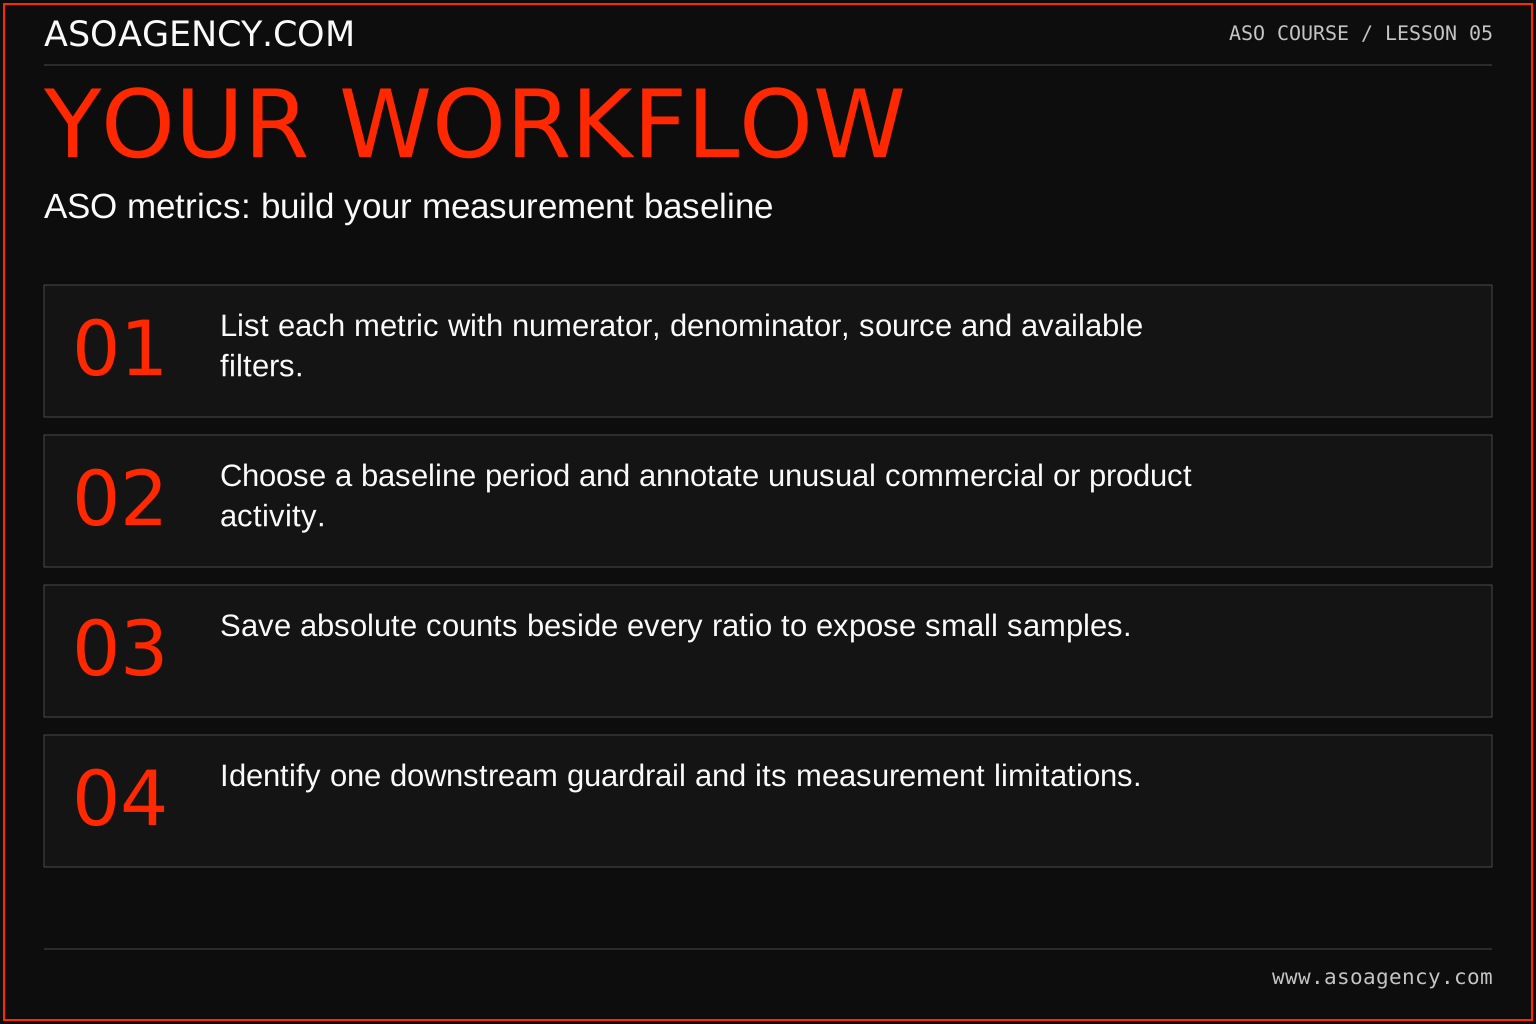
- List each metric with numerator, denominator, source and available filters.
- Choose a baseline period and annotate unusual commercial or product activity.
- Save absolute counts beside every ratio to expose small samples.
- Identify one downstream guardrail and its measurement limitations.
Worked example and interpretation
Trail Notes and numerical research scenarios are fictional teaching examples. Platform limits, where shown, come from the linked official references.
A worksheet records 600 downloads and 3,000 visitors for a defined illustrative segment, giving a visitor-to-download ratio of 20%. A second report shows 24%, but includes a different population. The team does not average the percentages or call the difference an uplift. They first reconcile definitions, then compare matching reports. If reconciliation is impossible, both metrics remain separately labeled.
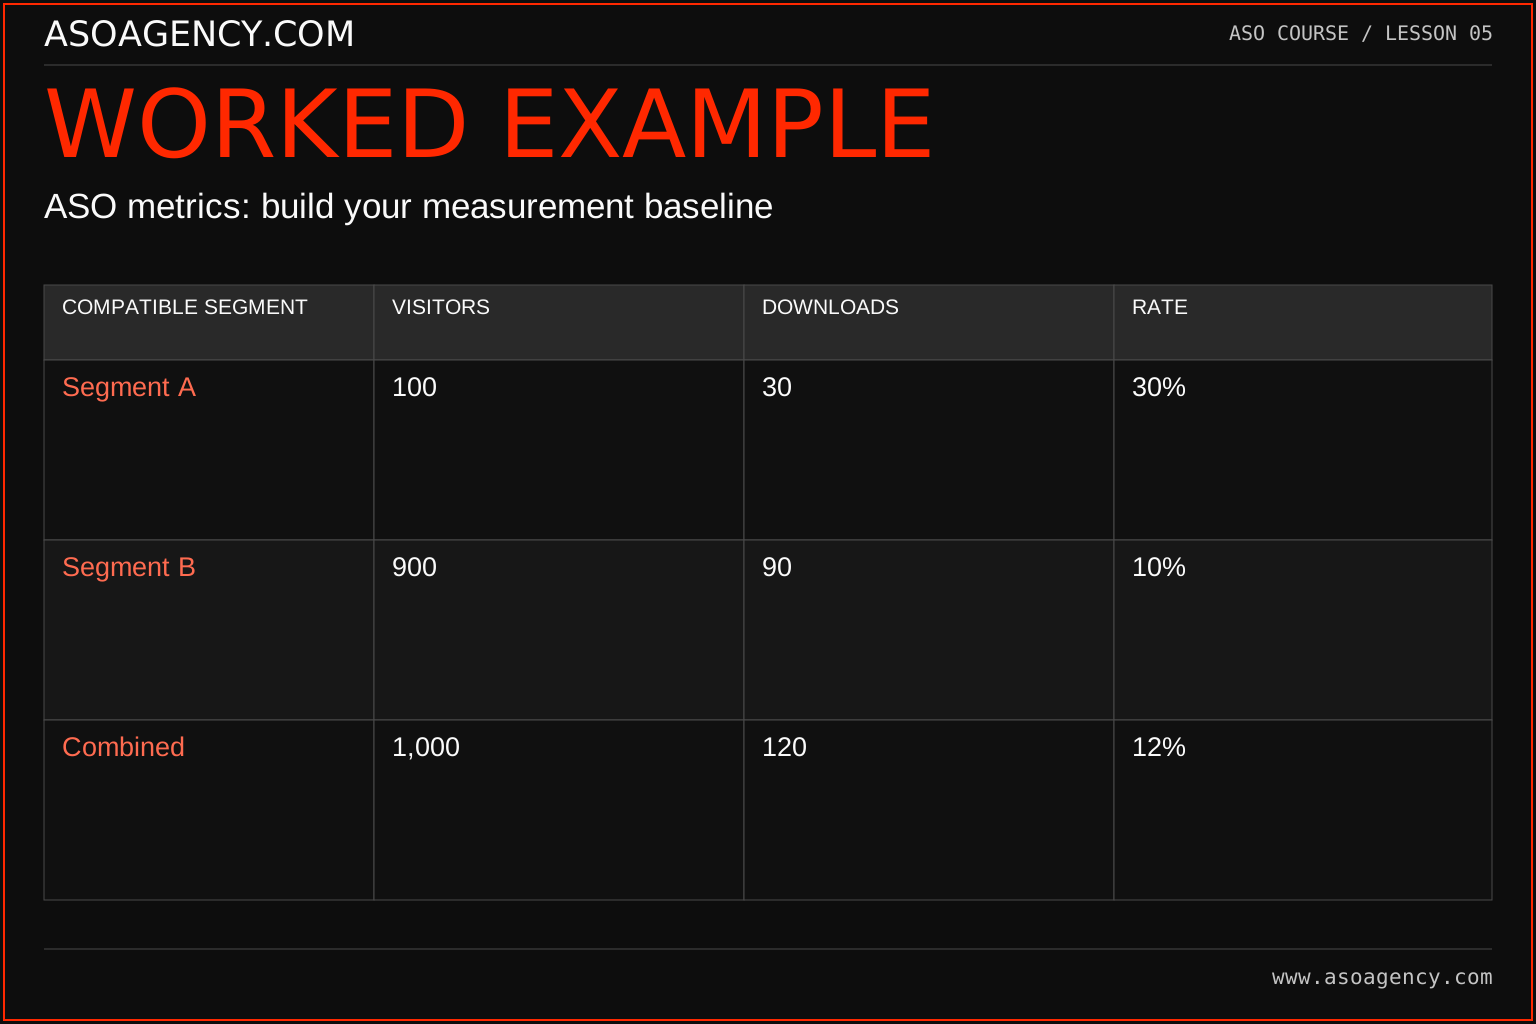
| Compatible segment | Visitors | Downloads | Rate |
|---|---|---|---|
| Segment A | 100 | 30 | 30% |
| Segment B | 900 | 90 | 10% |
| Combined | 1,000 | 120 | 12% |
The unweighted average of 30% and 10% is 20%, but the correct pooled rate for these compatible counts is 120 ÷ 1,000 = 12%. The larger segment contributes most visitors. This exercise does not mean every report can be pooled: first check whether the units, windows and eligibility rules match. Next, preserve A and B beside the total so a later increase in A's share is not mistaken for better performance inside both segments.
Build a handover someone can use
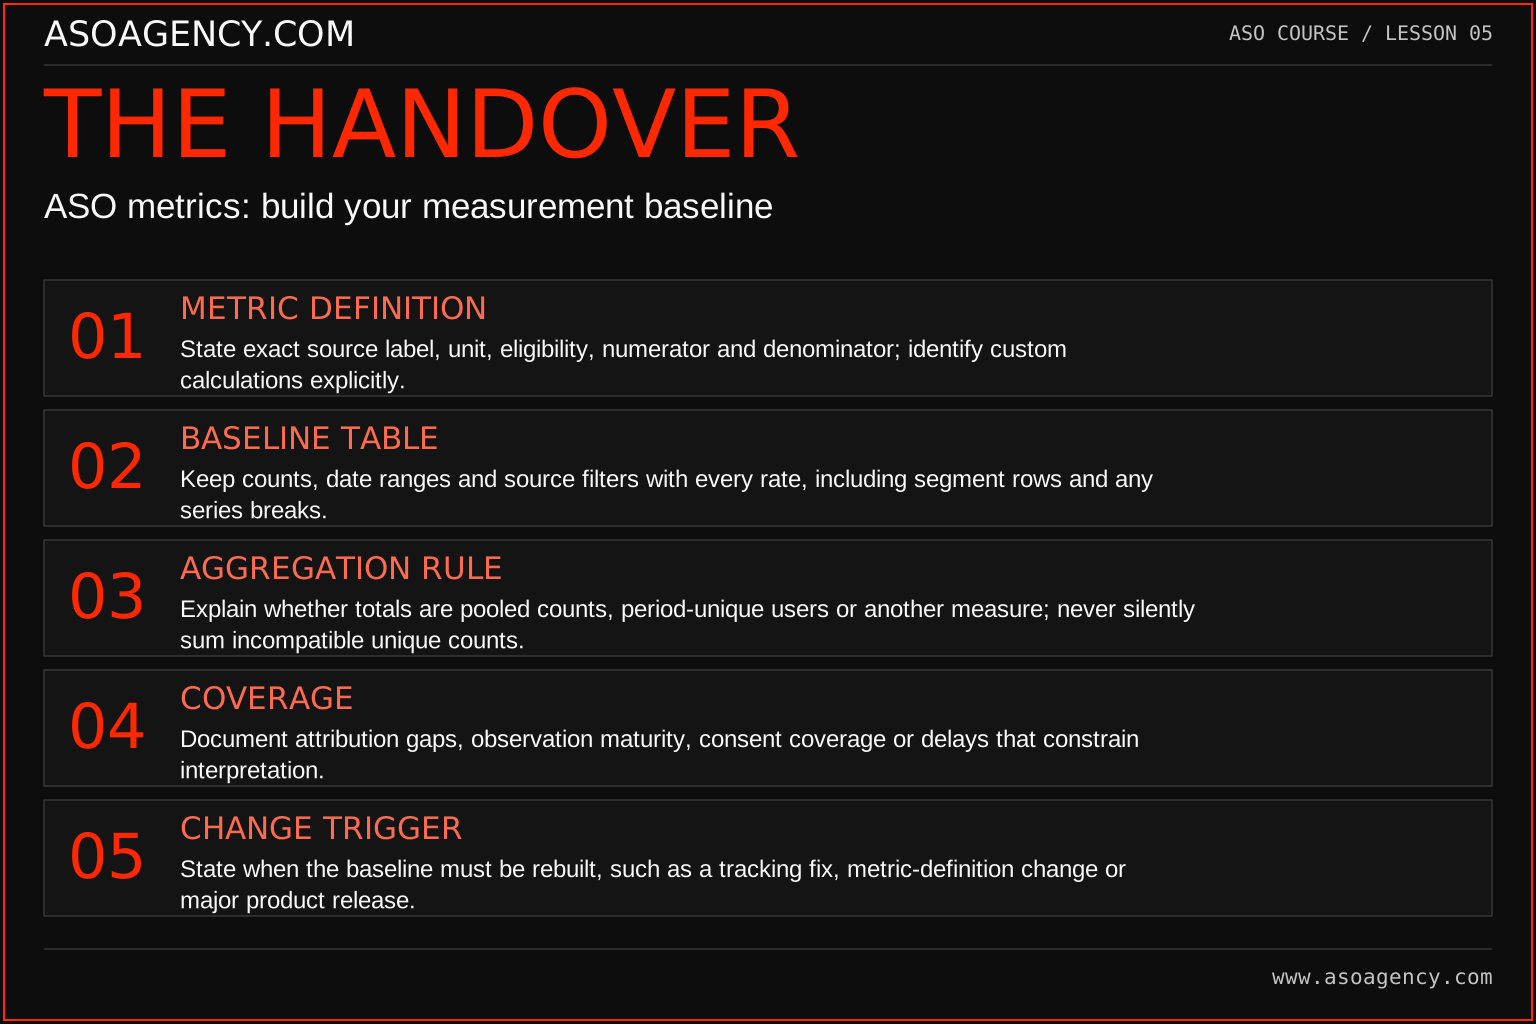
Metric definition
State exact source label, unit, eligibility, numerator and denominator; identify custom calculations explicitly.
Baseline table
Keep counts, date ranges and source filters with every rate, including segment rows and any series breaks.
Aggregation rule
Explain whether totals are pooled counts, period-unique users or another measure; never silently sum incompatible unique counts.
Coverage
Document attribution gaps, observation maturity, consent coverage or delays that constrain interpretation.
Change trigger
State when the baseline must be rebuilt, such as a tracking fix, metric-definition change or major product release.
Your ASO assignment
Use your own app and evidence, or work through the teaching case. Keep your observations separate from assumptions and explain the reasoning behind your decisions.
- Define five metrics relevant to your app.
- Calculate one ratio using explicit counts and show the formula.
- Write one example of two reports that should not be combined.
Scenario challenge
A stakeholder reports that two regions average 20% conversion using the rows above. Recalculate the pooled rate, explain the weighting in one sentence, and list two facts you must verify before treating those rows as a combined audience.
Assess your work
- The reader can reproduce every calculated rate.
- Absolute counts accompany percentages.
- Source definitions and custom calculations are clearly distinguished.
Common mistakes to catch
- Comparing percentages from different reports without checking their populations.
- Calling a two-percentage-point increase a two-percent relative increase.
Knowledge check
A rate moves from 20% to 22%. Express the change in two ways.
Read the answer and reasoning
The change is 2 percentage points and 10% relative to the original rate: (22−20)/20. This arithmetic says nothing by itself about statistical reliability or causation. Those require information about how the observations were collected and what else changed.
Sources and further reading
Platform references reviewed 29 September 2026. These sources support platform capabilities and constraints; the teaching frameworks, assignments and illustrative cases are original course material.
- Google Play — Understand and grow your user base — Current listing-click reporting, completed acquisitions and segmentation.
- Apple — Acquisition analytics — Acquisition metric definitions and source attribution.
Your ASO lesson notes
Use this space for your assignment, evidence and handover. Select Save to keep a draft in this browser, or download a copy to take with you.
Notes stay on this device and are not submitted to ASO Agency.
Complete your assignment with the App store conversion calculator.
Loading your progress…
Progress is saved only in this browser. It does not sync across devices. Mark a lesson complete after doing its exercise.