ASO course · lesson 40 of 60
ASO A/B test results: uplift and statistical uncertainty
Distinguish a numerical difference from reliable and commercially useful evidence.
By Gabriel Machuret · Editorial methodology
Before you start: Basic percentage arithmetic and a defined experiment outcome.
Module 7: Experiment design and interpretation
Plan about 55 minutes for reading, practice and review
You will produce: A statistical interpretation note separating effect, uncertainty, assumptions and practical value.
Understand the decision
Separate effect size from certainty
An observed rate difference is an estimate. Percentage-point change is the direct subtraction of rates; relative lift divides that change by the baseline. Neither calculation describes uncertainty. Small samples can produce large apparent differences by chance. A useful result report includes the observed effect, the uncertainty information supplied by the method and the business importance of plausible effects.
Understand an illustrative interval
For two independent fixed samples with binary outcomes and adequate counts, a simple normal-approximation interval uses the difference plus or minus 1.96 times its estimated standard error. This is a teaching illustration, not a replacement for native Bayesian or sequential store methods. Assumptions, allocation and stopping behavior matter; the same numbers do not justify every statistical procedure.
Interpret the decision range
If the uncertainty range includes both a meaningful loss and a useful gain, the current evidence may not support a confident adoption claim. Conversely, a tiny reliable effect may not justify expensive maintenance. Define practical importance before results arrive. Do not call “not decisive” the same as “no effect,” and do not read a confidence interval as a guarantee about every future audience.
Apply the method in practice
Calculate absolute and relative changes separately
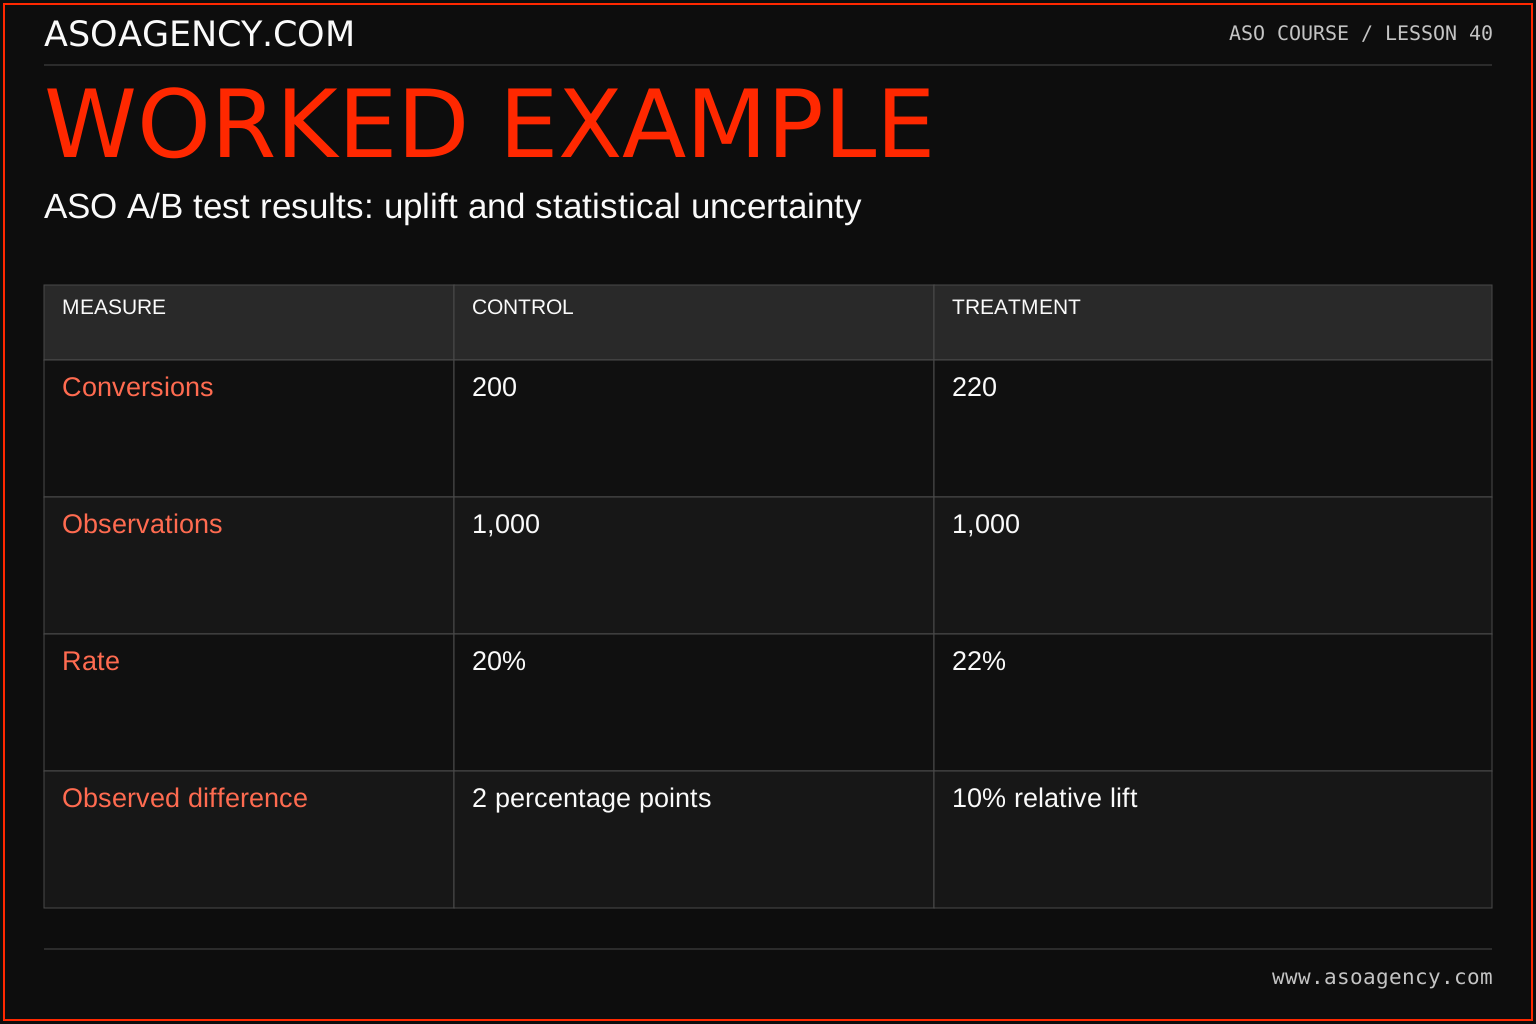
In a teaching example, 200 conversions from 1,000 observations is 20%, while 220 from another 1,000 is 22%. The absolute rate change is two percentage points. The relative lift is 2 ÷ 20 = 10%. The treatment produced 20 more conversions in these equally sized samples. All three statements are correct but answer different questions. Report original counts alongside rates so readers can see the sample size and avoid confusing percentage points with relative percentages.
Understand what an uncertainty interval adds
For a simplified fixed-sample comparison of independent proportions, an approximate standard error for the difference is the square root of p1(1−p1)/n1 + p2(1−p2)/n2. Here it is about 1.82 percentage points. A normal-approximation 95% interval around the two-point difference is roughly −1.57 to +5.57 percentage points. The observed lift is compatible with both a decline and an improvement under this model. This calculation has assumptions; it does not reproduce Apple's Bayesian PPO analysis or every sequential experiment system.
Connect the result to a business decision carefully
An interval spanning zero does not prove the treatments are identical. It means this analysis does not establish a clear direction at the stated level. Consider practical value, experiment validity and the cost of further learning. If the result is uncertain, choose a documented next action rather than rounding the point estimate into certainty. Do not repeatedly inspect a fixed-sample test and stop whenever a preferred threshold appears without an appropriate sequential design. Use the method that matches how the experiment was run.
Platform references for this work: NIST — Difference of proportions confidence interval · Apple — Product page optimization results
Your step-by-step procedure
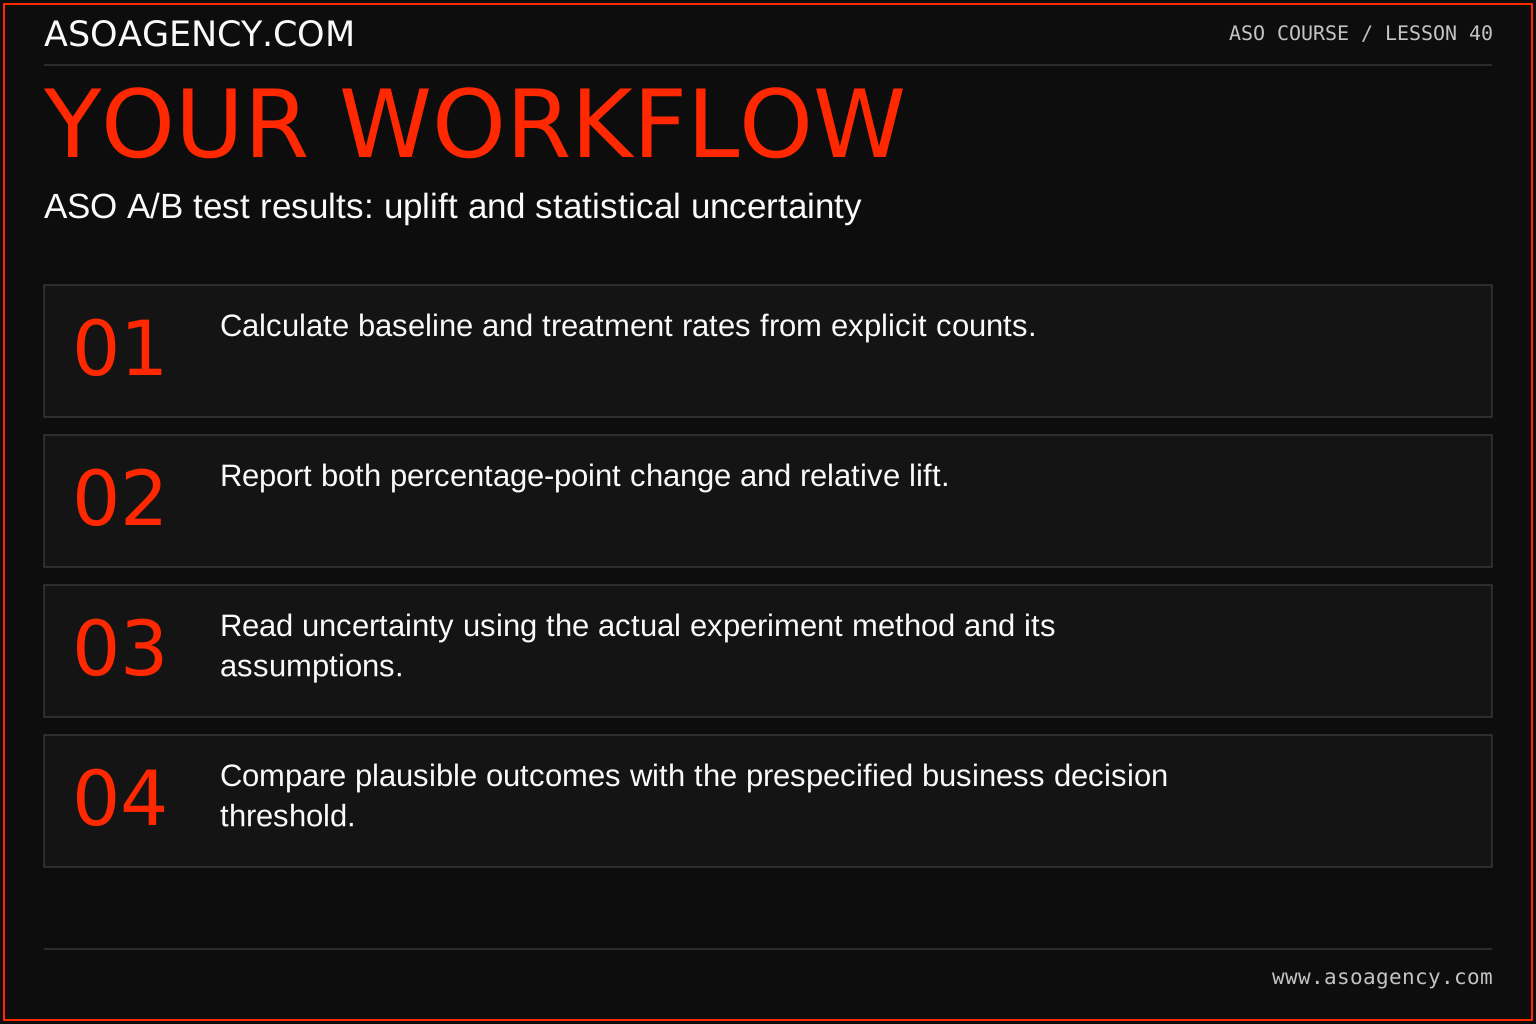
- Calculate baseline and treatment rates from explicit counts.
- Report both percentage-point change and relative lift.
- Read uncertainty using the actual experiment method and its assumptions.
- Compare plausible outcomes with the prespecified business decision threshold.
Worked example and interpretation
Trail Notes and numerical research scenarios are fictional teaching examples. Platform limits, where shown, come from the linked official references.
In an illustrative fixed-sample example, control has 200 successes from 1,000 observations and treatment has 220 from 1,000. Rates are 20% and 22%: +2 percentage points, or +10% relative. The simple independent-proportion standard error is approximately 1.82 percentage points, giving an illustrative 95% interval of about −1.57 to +5.57 points. That range includes a loss. These arithmetic results must not be substituted for a native store’s different statistical analysis.
| Measure | Control | Treatment |
|---|---|---|
| Conversions | 200 | 220 |
| Observations | 1,000 | 1,000 |
| Rate | 20% | 22% |
| Observed difference | 2 percentage points | 10% relative lift |
Using the stated approximation, the interval for the difference is about −1.57 to +5.57 percentage points. A report that says only “10% improvement” hides the uncertainty and the small absolute difference. A better readout includes counts, effect estimate, method, interval and decision. It also states whether assignment was valid and whether the calculation matches the platform's actual analysis. Arithmetic alone cannot repair a biased comparison.
Build a handover someone can use
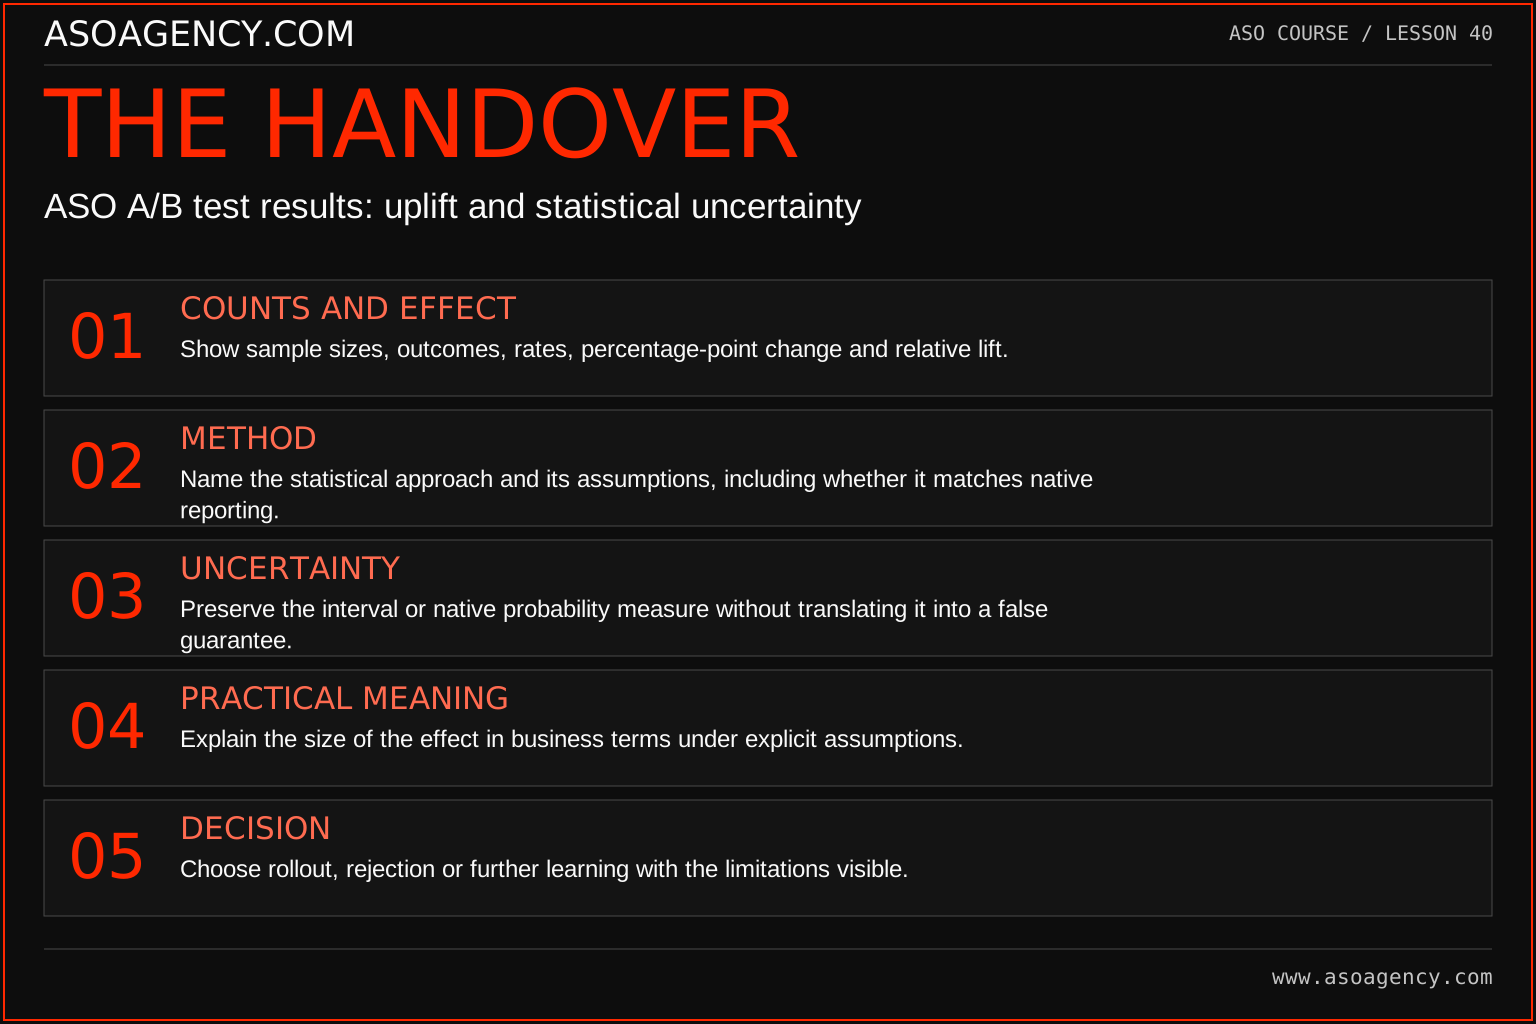
Counts and effect
Show sample sizes, outcomes, rates, percentage-point change and relative lift.
Method
Name the statistical approach and its assumptions, including whether it matches native reporting.
Uncertainty
Preserve the interval or native probability measure without translating it into a false guarantee.
Practical meaning
Explain the size of the effect in business terms under explicit assumptions.
Decision
Choose rollout, rejection or further learning with the limitations visible.
Your ASO assignment
Use your own app and evidence, or work through the teaching case. Keep your observations separate from assumptions and explain the reasoning behind your decisions.
- Reproduce the example’s rate, point change and relative lift.
- Explain what the illustrative range allows and does not establish.
- Write a decision for an effect that is reliable but too small to justify its cost.
Scenario challenge
Explain why “the test proves a 10% lift” is too strong for the example. Then explain why “there is definitely no difference” is also unsupported. Use the interval and method assumptions in your answer.
Assess your work
- Percentage points and relative lift are correctly distinguished.
- The statistical method is matched to its assumptions.
- Inconclusive evidence is not mislabeled as proof of no effect.
Common mistakes to catch
- Declaring a winner because one rate is numerically larger.
- Repeatedly applying a fixed-sample threshold while stopping whenever it looks favorable.
Knowledge check
Does +10% relative lift automatically justify rollout?
Read the answer and reasoning
No. Assess the uncertainty, design validity, practical value, maintenance cost and guardrails. The example’s point estimate is positive, but its illustrative interval includes a negative effect. A native platform may use a different method, which must be interpreted on its own terms.
Sources and further reading
Platform references reviewed 29 September 2026. These sources support platform capabilities and constraints; the teaching frameworks, assignments and illustrative cases are original course material.
- NIST — Difference of proportions confidence interval — Independent-proportion interval methods; distinct from native store experimentation.
- Apple — Product page optimization results — Native result interpretation and Bayesian analysis.
Your ASO lesson notes
Use this space for your assignment, evidence and handover. Select Save to keep a draft in this browser, or download a copy to take with you.
Notes stay on this device and are not submitted to ASO Agency.
Complete your assignment with the App store conversion calculator.
Loading your progress…
Progress is saved only in this browser. It does not sync across devices. Mark a lesson complete after doing its exercise.