ASO course · lesson 49 of 60
ASO analytics: traffic sources, markets and cohorts
Explain performance changes without confusing traffic composition, definitions and causality.
By Gabriel Machuret · Editorial methodology
Before you start: The metric dictionary, baseline exports and change log.
Module 9: Measurement and growth integration
Plan about 55 minutes for reading, practice and review
You will produce: A segmented performance analysis with reconciled metrics and explicit uncertainty.
Understand the decision
Reconcile definitions before charting
Use the current report’s actual metric names. Google’s listing guidance now distinguishes install/open/pre-registration clicks and click-through rate from completed acquisitions, which remain available in other reporting contexts. A click is not a completed install. Record the specific report, eligible population and date before comparing it with historical exports or another store’s conversion measure.
Segment totals to find composition effects
An overall rate can decline even when every segment improves if traffic shifts toward lower-rate segments. Review the most decision-relevant dimensions before concluding that the listing deteriorated. Do not keep slicing until a favorable story appears: use the audience and measurement plan to choose comparisons. Keep absolute counts so you can distinguish meaningful changes from tiny subgroups.
Write observations before explanations
Describe what changed, where and when, then connect the timeline to possible causes. A metadata update, campaign expansion, product release and reporting change may overlap. State which explanations the evidence supports and what remains unresolved. Causal language should match the design; a time correlation alone does not establish that the newest ASO task caused the result.
Apply the method in practice
Choose the comparison population explicitly
Name store, market, source, device context, new or returning users and the relevant time window. Keep source-system definitions intact. Apple's search acquisition source includes search-ad activity, so it should not automatically be renamed organic. Google's current listing-click reports and completed-acquisition reports describe different stages. A coherent analysis can use both if they remain correctly labeled. Do not merge incompatible units merely to produce a single tidy funnel. The reader should know exactly which users or devices each number describes.
Inspect composition before celebrating the total
An overall rate can rise because a higher-converting audience becomes a larger share, even when neither segment improves. Keep segment counts and rates beside the total. Aggregate compatible counts rather than averaging percentages. Investigate changes in paid campaigns, brand demand, markets and returning users. These can be commercially valuable changes, but they answer a different question from whether the listing became more persuasive for a stable audience. Explain both the aggregate business result and the within-segment observation.
Match the strength of the conclusion to the design
A before/after comparison shows an association in time. It does not by itself isolate the effect of a metadata change. Use the release log, source mix and product context to evaluate alternative explanations. If a controlled experiment exists, report its bounded result separately from the broader trend. When evidence is incomplete, specify the next decision it can support rather than discarding it or overstating it. A useful report can say growth occurred while attribution remains uncertain.
Platform references for this work: Google Play — Understand and grow your user base · Apple — Acquisition analytics
Your step-by-step procedure
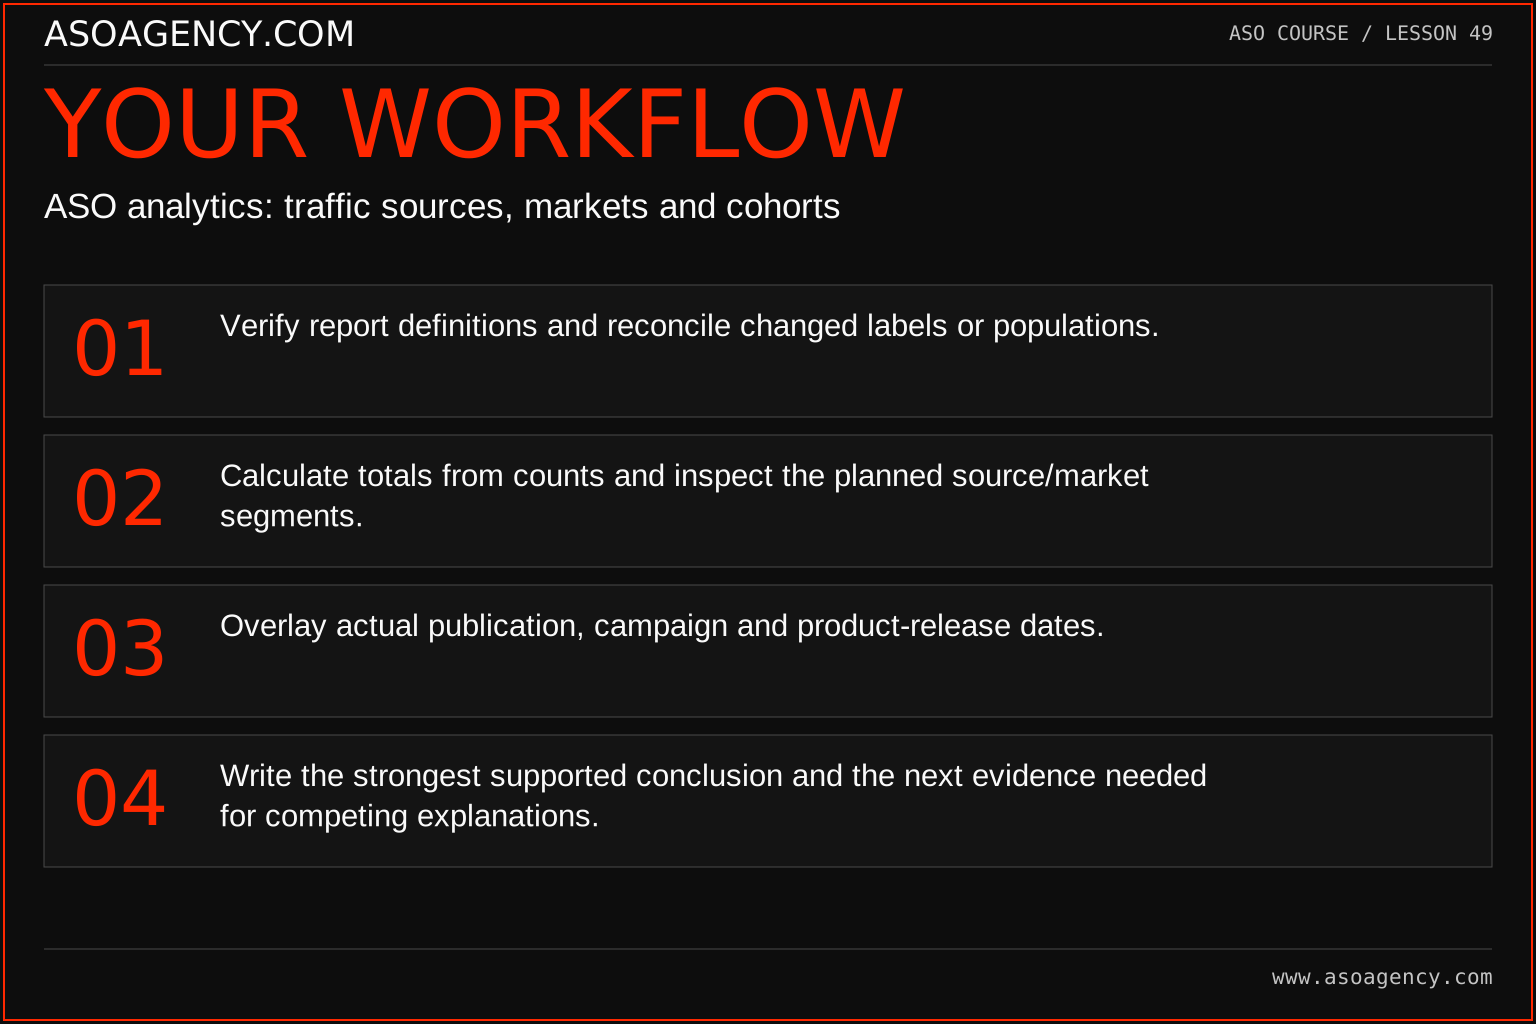
- Verify report definitions and reconcile changed labels or populations.
- Calculate totals from counts and inspect the planned source/market segments.
- Overlay actual publication, campaign and product-release dates.
- Write the strongest supported conclusion and the next evidence needed for competing explanations.
Worked example and interpretation
Trail Notes and numerical research scenarios are fictional teaching examples. Platform limits, where shown, come from the linked official references.
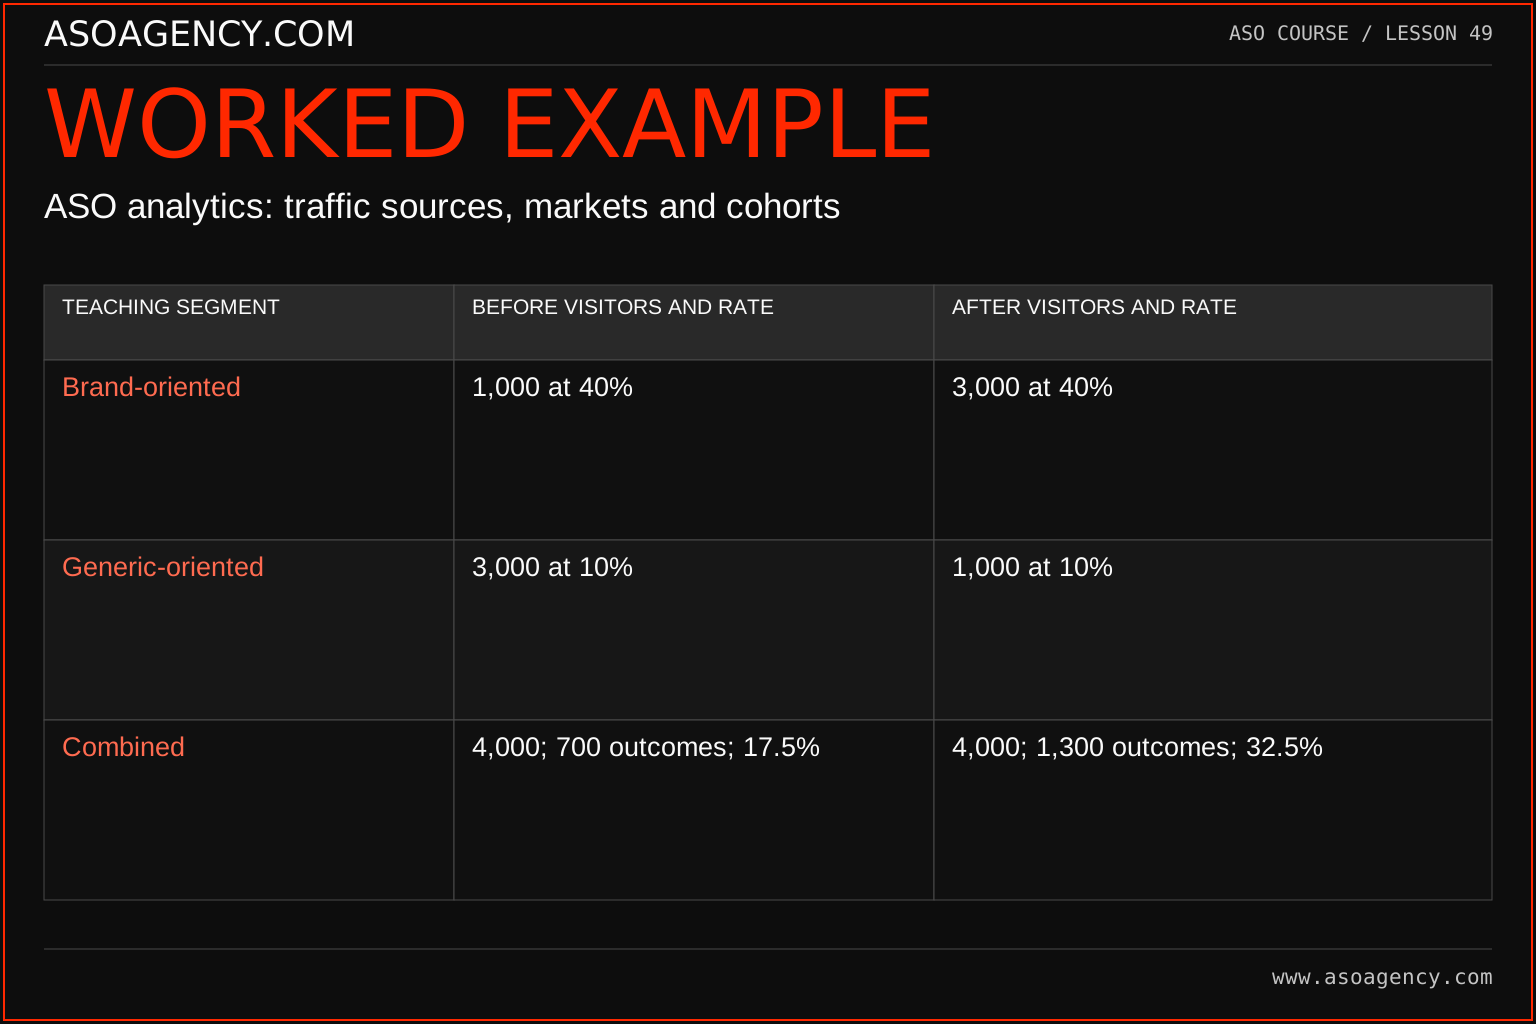
In a constructed comparison, brand-oriented traffic grows from 1,000 to 3,000 visitors while its outcome rate remains 40%. Generic-oriented traffic falls from 3,000 to 1,000 while its rate remains 10%. Total visitors stay at 4,000, but outcomes rise from 700 to 1,300 because of audience composition. The following table shows why an aggregate improvement need not be a within-segment listing improvement.
| Teaching segment | Before visitors and rate | After visitors and rate |
|---|---|---|
| Brand-oriented | 1,000 at 40% | 3,000 at 40% |
| Generic-oriented | 3,000 at 10% | 1,000 at 10% |
| Combined | 4,000; 700 outcomes; 17.5% | 4,000; 1,300 outcomes; 32.5% |
The total rate rises from 17.5% to 32.5%, but each segment's rate is unchanged. The increase comes entirely from audience composition in this constructed example. Calling it a listing-conversion improvement would misdescribe the mechanism. The business may still value the additional outcomes. Report both facts: more outcomes overall and no observed within-segment rate improvement. Then investigate what changed the traffic mix.
Build a handover someone can use
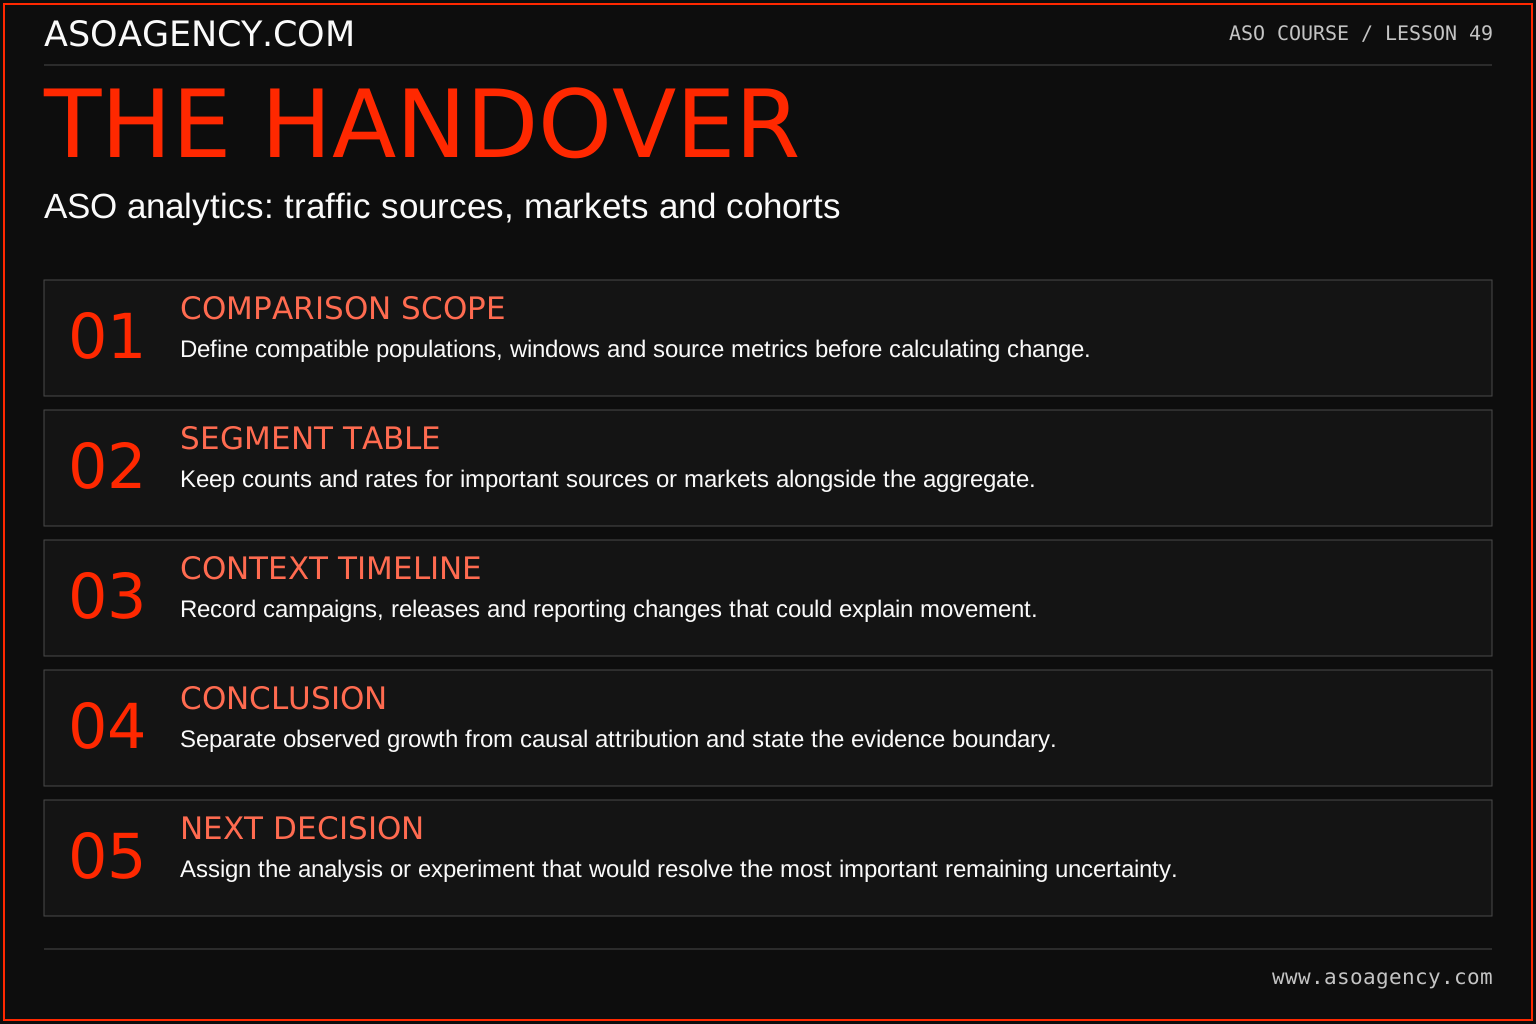
Comparison scope
Define compatible populations, windows and source metrics before calculating change.
Segment table
Keep counts and rates for important sources or markets alongside the aggregate.
Context timeline
Record campaigns, releases and reporting changes that could explain movement.
Conclusion
Separate observed growth from causal attribution and state the evidence boundary.
Next decision
Assign the analysis or experiment that would resolve the most important remaining uncertainty.
Your ASO assignment
Use your own app and evidence, or work through the teaching case. Keep your observations separate from assumptions and explain the reasoning behind your decisions.
- Reproduce the composition example from counts.
- Choose two appropriate segments for your app and explain why.
- Write an observation, a hypothesis and a limitation about a real or practice report.
Scenario challenge
Use the table to calculate both pooled rates. Then write a two-sentence executive summary that recognizes the business gain without crediting the listing with an unobserved within-segment improvement.
Assess your work
- Source definitions remain attached to calculated rates.
- Traffic-mix changes are considered before creative conclusions.
- Causal claims do not exceed the comparison design.
Common mistakes to catch
- Averaging segment percentages without weighting by their denominators.
- Calling all search-attributed activity necessarily organic-only.
Knowledge check
Both segment rates improve but the overall rate falls. Must there be a calculation error?
Read the answer and reasoning
No. A shift toward a lower-rate segment can reduce the weighted total. Recalculate from absolute counts and inspect the mix. Once verified, explain the composition change separately from the within-segment performance so stakeholders do not optimize against a misleading aggregate story.
Sources and further reading
Platform references reviewed 29 September 2026. These sources support platform capabilities and constraints; the teaching frameworks, assignments and illustrative cases are original course material.
- Google Play — Understand and grow your user base — Current listing-click reporting, completed acquisitions and segmentation.
- Apple — Acquisition analytics — Acquisition metric definitions and source attribution.
Your ASO lesson notes
Use this space for your assignment, evidence and handover. Select Save to keep a draft in this browser, or download a copy to take with you.
Notes stay on this device and are not submitted to ASO Agency.
Complete your assignment with the App store conversion calculator.
Loading your progress…
Progress is saved only in this browser. It does not sync across devices. Mark a lesson complete after doing its exercise.